
For investors watching chart patterns and momentum, a methodical way to spot possible trades can make the process more efficient. One technique is to look for stocks that show both good basic technical condition and a favorable price pattern, hinting at a possible move out of a period of sideways action. This tactic depends on two specific measures: the ChartMill Technical Rating, which measures a stock's trend force and comparative results, and the ChartMill Setup Quality Rating, which judges the condition of its present price formation. By merging these ratings, traders try to locate stocks with good technicals that are preparing for their next possible price change.
LXP Industrial Trust (NYSE:LXP) recently appeared from such a search, showing a profile that fits this breakout technique. As a real estate investment trust concentrated on industrial warehouse and distribution properties, its recent technical activity offers an interesting example for this tactic.
A Base of Technical Force
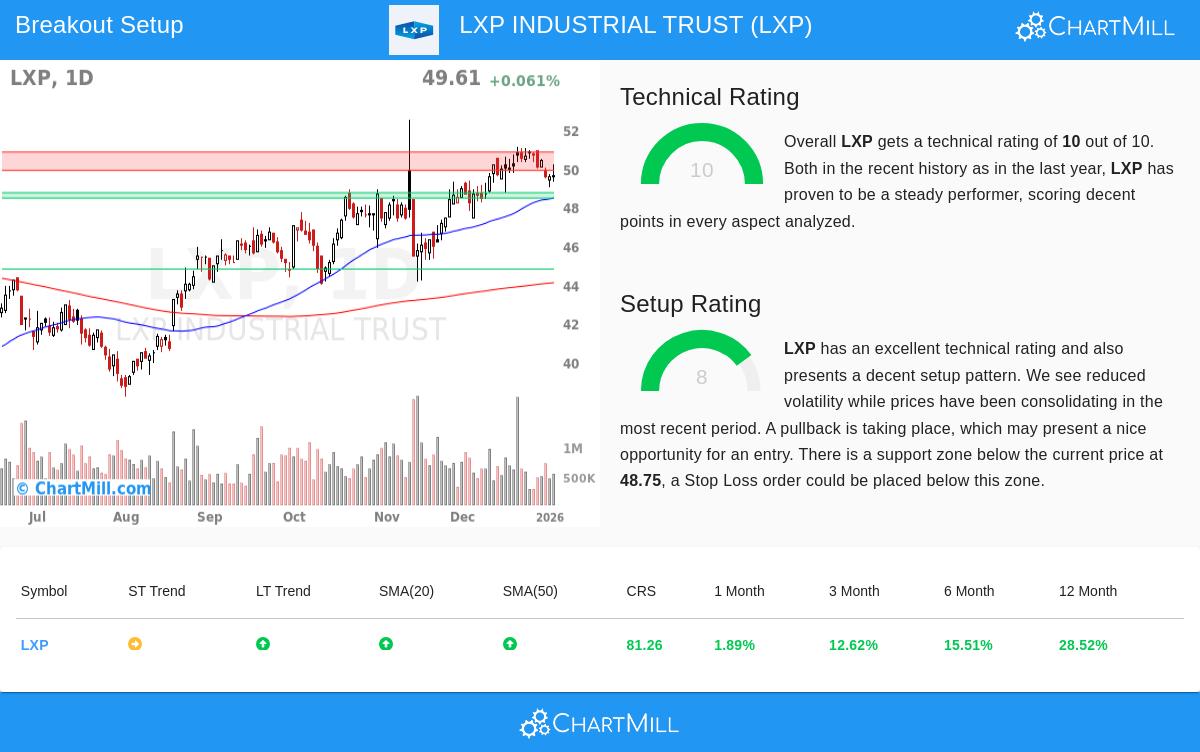
The key part of this tactic is first confirming that a stock is in a good upward trend, as a solid base raises the chance that a breakout will follow the existing direction. LXP Industrial Trust does very well here, receiving a complete ChartMill Technical Rating of 10 out of 10. This highest rating shows very good technical condition across several time periods and comparisons.
A close look at the full technical report shows the bases of this force:
- Long-Term Trend Soundness: The long-term trend is clearly positive, an important element for keeping momentum. The stock trades notably above its main moving averages (20, 50, 100, and 200-day SMAs), all of which are arranged in rising patterns.
- Better Comparative Results: LXP has done much better than the wider market and similar companies. Its performance over one year beats 81% of all stocks, and inside the Diversified REITs field, it beats 86% of its rivals.
- Good Support Framework: The analysis finds seven separate support areas below the present price, with the closest important area between $48.47 and $48.75. This layered support gives a clear structure for handling risk, as it marks places where buying activity has often appeared before.
This good technical background is needed for the tactic because it indicates the stock is a market frontrunner, not just having a short-lived rise. A breakout from a stock with poor technicals has a greater chance of not working.
A High-Condition Formation for a Possible Breakout
While a strong trend is required, it is not enough for a best entry point. A stock can be stretched, making a new position open to a decline. This is where the Setup Quality Rating becomes key, spotting times of sideways action where price movement narrows and the stock gathers energy for its next upward step. LXP gets a Setup Rating of 8, meaning a high-condition formation pattern.
The technical report lists the details of this formation:
- Narrow Sideways Action: Over the last month, LXP has traded in a small band between about $48.24 and $51.10. This price tightening is a typical sign of a period of sideways action.
- Nearness to Moving Averages: The present price is trading close to main short-term averages, hinting the stock is not far from its average and is in a state of balance.
- Clear Risk Outline: The formation has developed just above the good support area near $48.75. This supplies a sensible and close level for a protective stop-loss order, allowing for exact risk control if the expected breakout does not happen.
The existence of this high-condition formation specifically answers the "when" to buy. It hints the stock is resting inside its confirmed upward trend, giving a possible entry point with a well-marked level of risk, instead of following a stock that has already made a big, sudden move.
A Specific Trading Example
From this analysis, the technical report describes a sample trading plan that shows how a technical investor might look at LXP. It proposes a possible entry on a move above $50.27, which would mark a break from the recent sideways range. A stop-loss order is suggested just below the support area at $49.02, which would mean a risk of about 2.5% on the trade. This example shows how the mix of strong technicals and a clear formation can become a structured plan with specific entry and exit points.
Locating Additional Chances
LXP Industrial Trust shows the kind of chance the Technical Breakout search is made to find: a stock with leading trend force taking a break before its next possible rise. For investors wanting to use this technique on the present market, new possible formations are found each day.
You can see today's list of matching stocks by going to the Technical Breakout Setups search.
Disclaimer: This article is for information only and is not investment advice, a suggestion, or an offer to buy or sell any security. The trading plan described is an automatic example for learning and is not a suggestion. Investing has risk, including the possible loss of your initial investment. Always do your own research, think about your money situation and risk comfort, and talk with a qualified financial advisor before making any investment choices. Past results do not guarantee future outcomes.