
In growth investing, few methods are as disciplined and focused on results as the strategy made known by Mark Minervini. This method mixes strict technical study with firm fundamental checks to find market leaders before their largest price gains. The center of the technical choice is the Minervini Trend Template, a group of rules made to find stocks in strong, confirmed uptrends. To confirm these are sound in both technique and business foundation, the method is frequently used with a look at high-growth momentum, searching for firms with quickening profits, solid sales increases, and good analyst changes. This two-part method tries to find stocks with both the price pattern and business speed to give large returns.
JABIL INC (NYSE:JBL) appears as a strong candidate when judged through this joined structure. The electronics manufacturing solutions company has displayed a notable technical and fundamental picture that matches the standards looked for by investors focused on growth.
A Clear Trend Template Candidate
The Minervini Trend Template is made to remove uncertainty and personal judgment, depending on clear, yes-or-no standards to verify a stock's strength. Jabil's present chart shows a clear match with these rules, which are vital for confirming a stock is in a lasting "Stage 2" climb and not a short-lived rise.
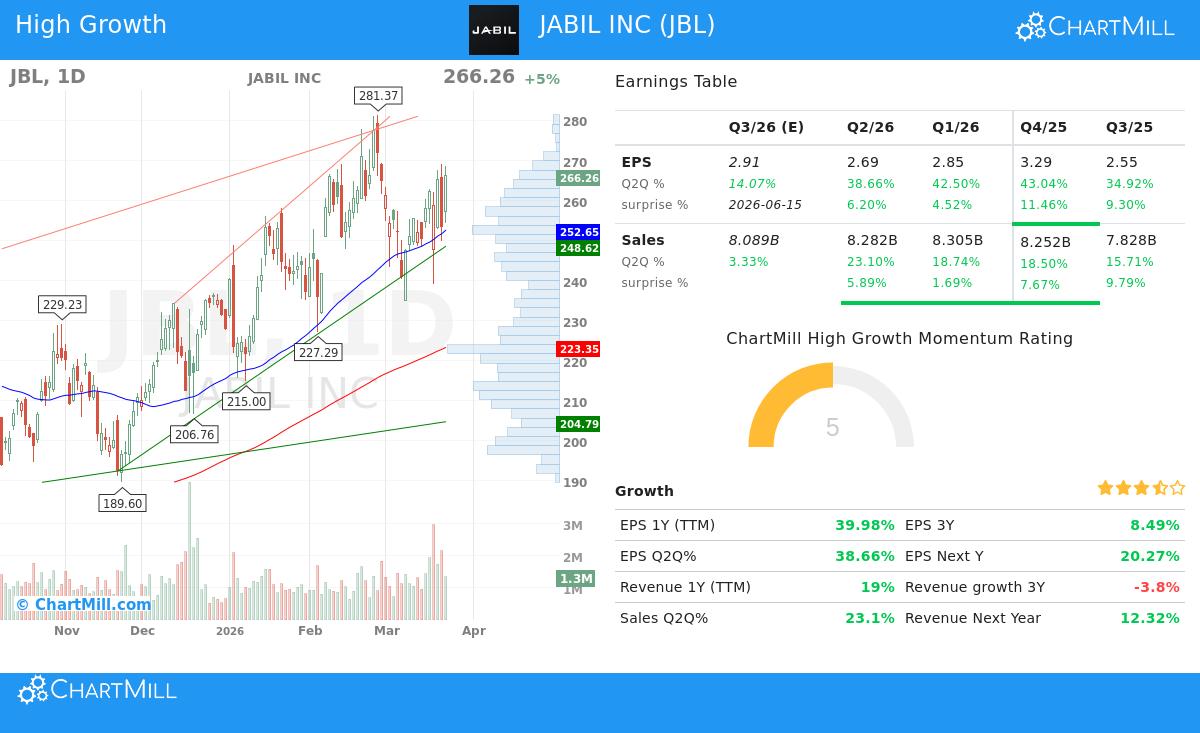
- Price Above Important Moving Averages: The stock's last price of $266.26 trades well above its rising 50-day ($252.65), 150-day ($226.85), and 200-day ($223.35) simple moving averages (SMAs). This layered order shows positive momentum across short, medium, and long-term periods.
- Moving Average Order: The 50-day SMA is above both the 150-day and 200-day SMAs, and the 150-day SMA is above the 200-day. This step-by-step order is a sign of a sound, speeding uptrend where shorter-term momentum guides longer-term direction.
- Nearness to Highs: At $266.26, JBL is trading within 5.4% of its 52-week high of $281.37 and is 145% above its 52-week low of $108.66. Minervini's thinking stresses that strength leads to more strength; leaders tend to reach new highs, not bounce back from large lows.
- Better Relative Strength: With a ChartMill Relative Strength (CRS) score of 93.3, JBL is doing better than 93% of the whole market. High relative strength is essential in this method, as it finds the stocks that large funds are buying, frequently well before the wider market sees their possibility.
This technical view confirms a stock controlling its own trend, a main need before any fundamental study is thought about in the Minervini process.
Fundamentals Supporting the Momentum
A solid chart is only part of the account. The "High Growth Momentum" part of the screen looks into the fundamental engine pushing the price movement. Jabil's recent financial results show the kind of quickening growth that draws large fund money and maintains advances.
- Earnings Strength Shown: The company's trailing twelve-month (TTM) EPS of $11.38 shows a strong 40% year-over-year growth. More notably, recent quarterly EPS growth has been very large, with the last three quarters showing year-over-year gains of 38.7%, 42.5%, and 43.0%, in order. This pattern of speeding up is an important sign of fundamental momentum.
- Steady Performance: Jabil has passed analyst EPS guesses in each of the last four quarters, with an average surprise of 7.9%. This steady skill to beat guesses builds trust with investors and often leads to higher changes in future guesses.
- Solid Revenue and Cash Flow Increase: Top-line growth is also strong, with TTM revenue up 19% and recent quarterly sales growth near 23%. Also, free cash flow per share has jumped 46% over the past year, giving the company financial room and proving the quality of its profits.
- Good Analyst View: The market's forward-looking belief is seen in analyst changes. Over the past three months, the average guess for Jabil's next-year EPS has been changed higher by almost 5%, while revenue guesses have been raised by 3.9%. This upward path in hopes is a strong force for more price gains.
These measures together show a picture of a company not just growing, but speeding its growth at a high rate,a fundamental picture that exactly matches its strong technical breakout.
Technical Condition and Setup Evaluation
ChartMill's own study gives a combined view of Jabil's technical position. The stock gets a very good Technical Rating of 9 out of 10, showing its solid long-term uptrend, better relative strength, and order above important moving averages. The report states the stock is trading in the upper part of its 52-week range, acting in line with a market that is also near highs.
The Setup Quality Rating is a 6, showing that while the long-term trend is perfect, the stock's recent price movement has been a bit unsteady, making a perfect, low-risk entry point less clear at this precise time. The study proposes waiting for a time of settling to form a more certain support level before starting a new position. For a full breakdown of the support and resistance levels, and a sample trade setup, you can see the full technical analysis report for JBL.
Conclusion
Jabil Inc. gives a strong example of a security that fits the strict, multi-part standards of a joined Minervini and high-growth momentum method. Its chart follows the disciplined rules of the Trend Template, confirming a leading Stage 2 uptrend backed by large fund buying. Supporting this technical strength is a fundamental account of quickening earnings, solid sales growth, and increasing analyst hopes,the exact force that drives lasting high-momentum moves.
While the very good technical rating confirms the trend's soundness, the medium setup score acts as a useful note for investors to focus on disciplined entry points, even in the strongest stocks. For investors looking for other candidates that pass this strict two-part screening process, you can view the live results of the 'High Growth Momentum + Trend Template' screen here.
Disclaimer: This article is for information and learning only. It is not meant as investment advice, a suggestion, or an offer to buy or sell any securities. The study is based on given data and certain methods, but past performance does not show future results. Investors should do their own research and talk with a qualified financial advisor before making any investment choices. Please read our full disclaimer here.