
For investors looking for a systematic way to find high-growth market leaders, the CANSLIM method, created by William O'Neil, is a foundational strategy. It mixes strict fundamental study with important technical signs to find stocks with solid earnings momentum, support from large funds, and favorable market movements. The aim is to locate companies showing strong growth that is also being seen and supported by the wider market.
A recent scan using main CANSLIM filters has identified IRSA Inversiones y Representaciones SA (NYSE:IRS), an Argentine real estate group, as a possible candidate. We will look at how IRS matches the strategy's important standards.
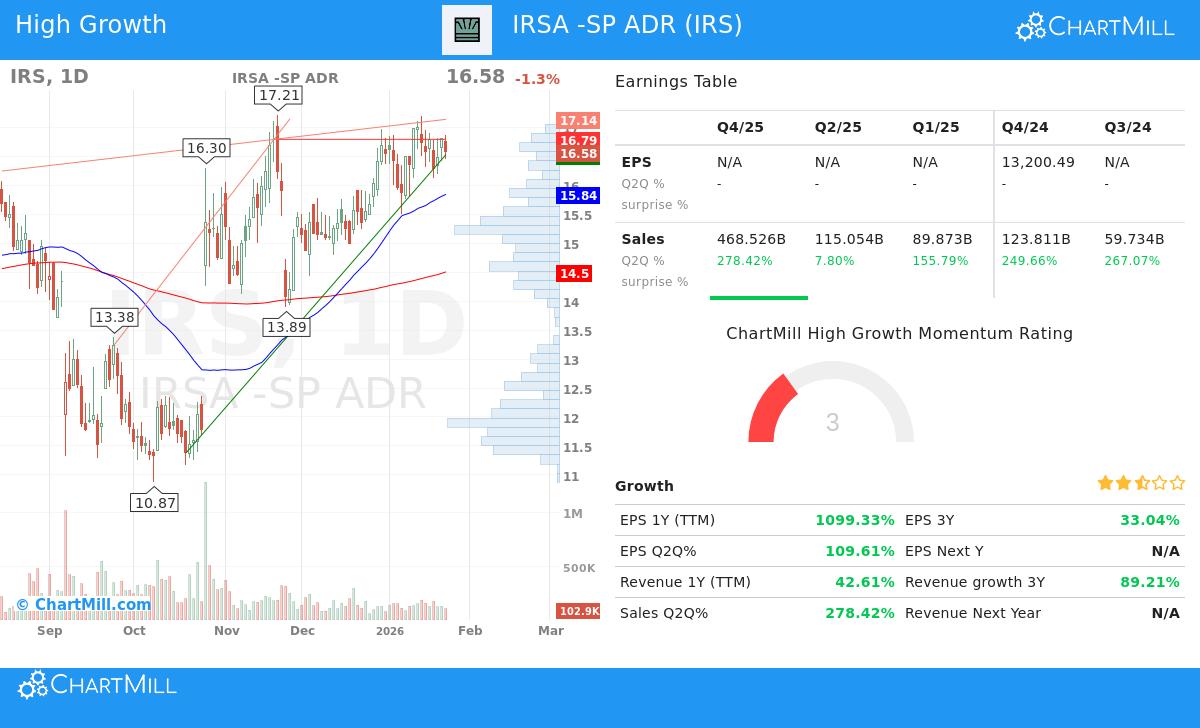
Looking at the Fundamental "CAN" Standards
The "CAN" in CANSLIM centers on current and yearly earnings power. IRS displays very high growth in the latest quarter, a main requirement for the system.
- Current Quarterly Earnings & Sales (The "C"): The strategy wants large, speeding quarterly growth. IRS shows a very high 109.6% year-over-year earnings per share (EPS) growth and a 278.4% rise in revenue for its last quarter, well above the usual minimum levels of 20-25%. This points to strong, present business momentum.
- Annual Earnings Increases (The "A"): CANSLIM wants steady yearly growth. IRS has a three-year EPS compound annual growth rate (CAGR) of about 33%, above the 25% mark. This implies the recent high quarter is not a one-time event but part of a continued growth path.
- Return on Equity (The "A" - Profitability): A high Return on Equity (ROE) shows good use of shareholder money. With an ROE of 12.37%, IRS is in the top 10% of its Real Estate Management & Development industry, showing better profit, a main idea of the strategy.
Reviewing the "SLIM" Parts
The "SLIM" parts deal with market notice, ownership, and timing.
- Leader or Laggard (The "L"): This is checked by relative strength (RS), which matches a stock's price action to the wider market. A high RS shows leadership. IRS has a solid relative strength of 84.36, meaning it has done better than about 84% of all stocks. For CANSLIM investors, this technical sign is necessary; it shows the market is valuing the strong fundamentals.
- Institutional Sponsorship (The "I"): The strategy likes stocks with increasing institutional ownership, but not so high that all possible buying is done. IRS shows a very small institutional ownership of 6.33%, which is much lower than the scan's limit of 85%. This might be seen as a large chance for future institutional finding and buying if the company's growth story gets wider notice.
- Supply & Demand / Financial Health (The "S"): CANSLIM likes companies with a good balance sheet. IRS keeps a careful debt-to-equity ratio of 0.33, which is not only good but also safely below the scan's need of 2.0. This points to a smaller financial risk level.
Technical and Fundamental Overview
A check of IRS's own reports gives a combined view. The fundamental analysis report gives IRS a score of 4 out of 10, noting its very good profit margins and excellent recent growth, but seeing issues in financial health measures and a lack of future earnings guesses.
On the other hand, the technical analysis report is notably strong, with a score of 9 out of 10. It states that both short-term and long-term trends are good, the stock is trading near 52-week highs, and it shows a reasonable setup shape with clear support and resistance levels. This technical power fits well with the CANSLIM focus on buying leaders as they come from good chart patterns.
Market Setting and Points to Think About
The CANSLIM system's last "M" means Market Direction, telling investors to match the general market trend. At this time, the S&P 500 shows a good short-term trend, which gives a supportive setting for using such a growth-focused strategy. Still, investors should know that IRS is an Argentine ADR, which adds extra levels of country-specific economic and currency risk that are not found by usual scans.
A Candidate for More Study
Based on the number-based filters coming from the CANSLIM method, IRSA Inversiones y Representaciones SA shows a notable profile. It displays very high quarterly growth, solid yearly earnings gains, high profit, market-leading relative strength, and a good balance sheet, all while trading in a positive technical and general market trend. The small institutional ownership suggests it may still be unnoticed by bigger funds.
For investors wanting to look at other stocks that pass similar strict growth and momentum filters, you can see the full O'Neill CANSLIM High Growth screen.
Disclaimer: This article is for information and learning only and is not investment advice, a suggestion, or an offer or request to buy or sell any securities. The study is based on given data and certain scanning rules; it is not a full study of the company. All investing has risk, including the chance of losing the original amount. Past results do not promise future results. You should do your own study and talk with a qualified financial advisor before making any investment choices.