
SAMSARA INC-CL A (NYSE:IOT) has been identified as a standout technical breakout candidate by our stock screener. The stock exhibits strong technical health and a high-quality setup pattern, making it worth a closer look for traders.
Technical Strength
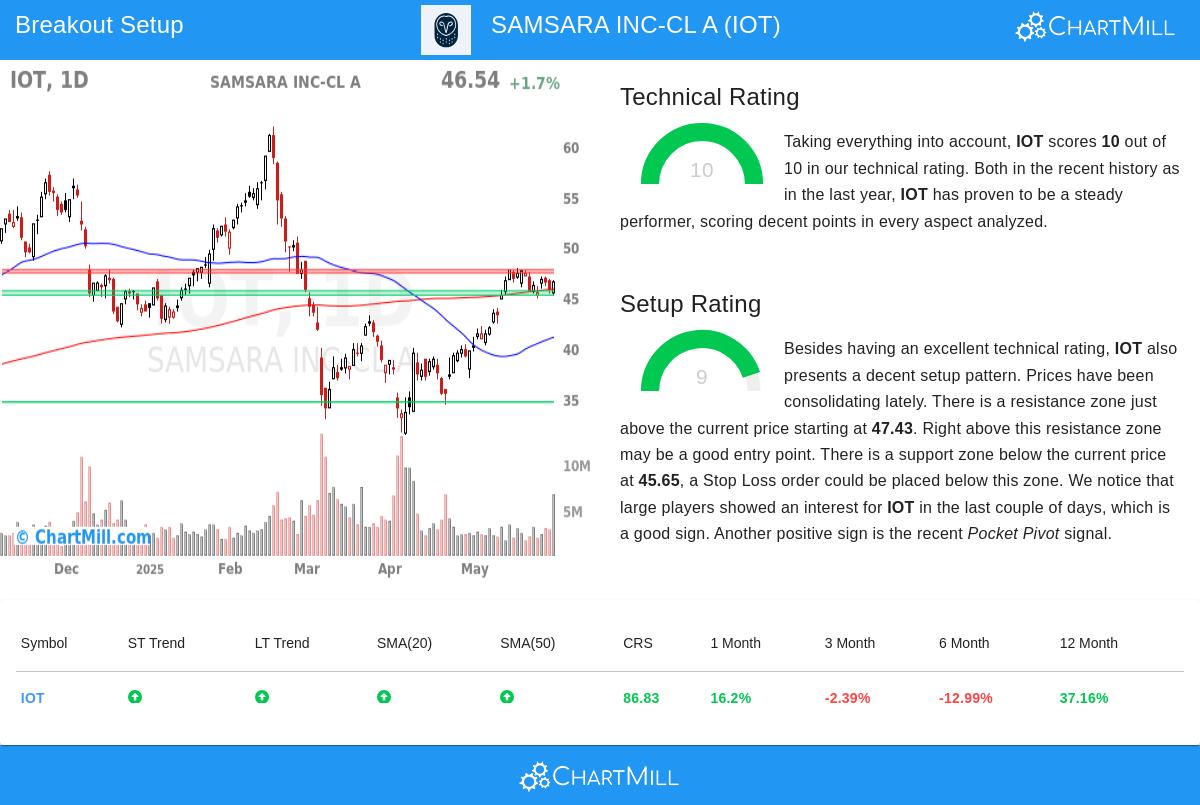
- Perfect Technical Rating (10/10): IOT scores the highest possible rating, reflecting strong momentum across both short-term and long-term trends.
- Relative Strength: The stock outperforms 86% of all market stocks over the past year and ranks above 71% of its peers in the software industry.
- Bull Flag Pattern: A recent pullback after a strong upward move suggests a potential continuation of the uptrend.
- Support from Moving Averages: The stock trades above key moving averages (20-day, 50-day, 100-day, and 200-day), confirming bullish momentum.
Setup Quality
- High Setup Rating (9/10): Recent price consolidation indicates a well-defined trading range, improving the likelihood of a breakout.
- Clear Support and Resistance: A support zone between $45.23-$45.65 provides a logical stop-loss level, while resistance near $47.43-$47.75 marks a potential breakout point.
- Institutional Interest: Large players have shown buying interest, and a recent "Pocket Pivot" signal—a bullish volume pattern—adds further confirmation.
- Low-Risk Entry: A breakout above $47.76 could serve as an entry, with a stop-loss just below $45.22, limiting downside risk to ~5.3%.
For a deeper analysis, review the full technical report for IOT.
Our Technical Breakout Setups screener updates daily with new opportunities.
Disclaimer
This is not investing advice. Always conduct your own research and consider risk management before trading.