
Investors looking to find high-potential stocks frequently use systematic methods that mix strict technical study with basic growth measures. One well-known method is the Mark Minervini strategy, which uses a defined Trend Template to locate stocks in established, strong uptrends. This technical base is paired with a review of a company's basic momentum, searching for quickening earnings, sales expansion, and favorable analyst estimate changes. The aim is to locate securities where solid price movement is backed by foundational business health, establishing a possible path for major growth.
INNOVIVA INC (NASDAQ:INVA) recently appeared from a screening process made to use this two-part method. The screen first applies Minervini's Trend Template rules to confirm a stock is in a technically good uptrend, then adds a "High Growth Momentum" rating to sort for companies showing solid fundamental growth. This pairing seeks to separate leaders that are not only advancing but have the financial strength to possibly continue that movement.
Meeting the Minervini Trend Template
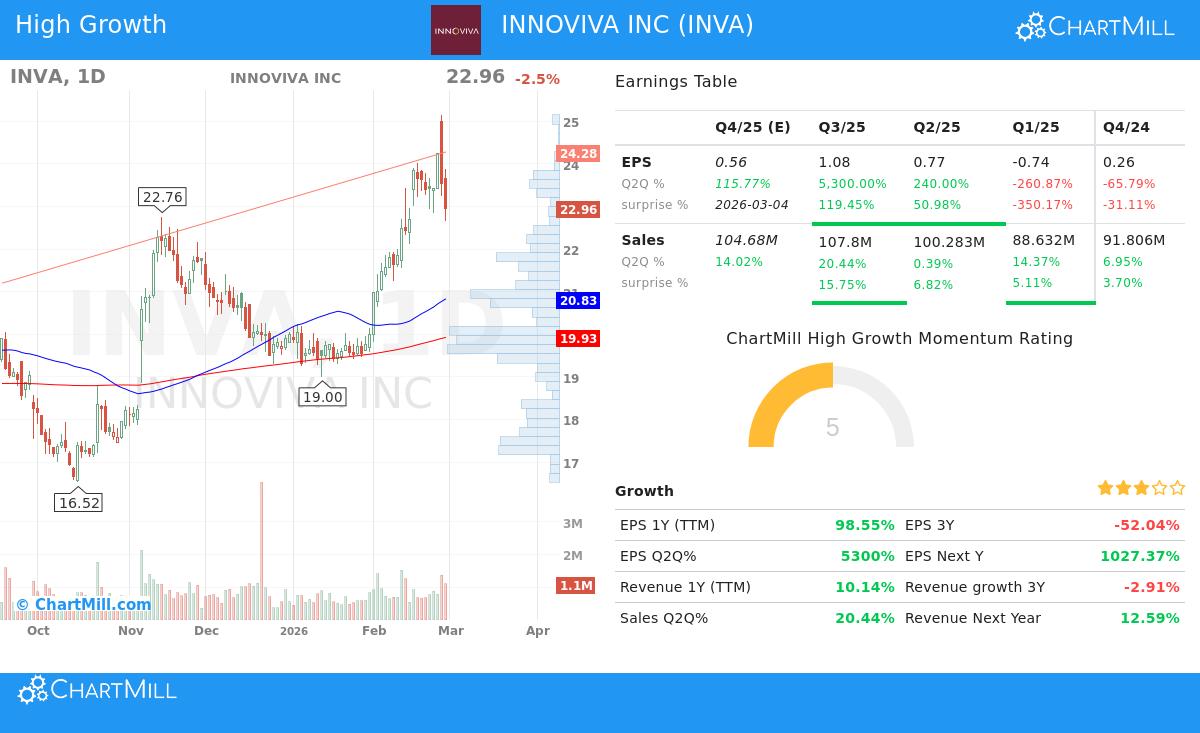
The center of Minervini's strategy is his Trend Template, a group of fixed technical requirements that verify a stock is in a solid, institution-quality uptrend. For a stock to pass, it must show agreement across several time periods and display strength compared to the wider market. A look at Innoviva's chart and important measures shows it currently meets these key technical points:
- Trend Agreement: The stock's present price trades above its rising 50-day, 150-day, and 200-day simple moving averages (SMAs). Importantly, the nearer-term 50-day SMA ($20.83) is placed above both the 150-day ($19.94) and 200-day ($19.93) averages, confirming the uptrend's force and speed.
- Nearness to Highs: A sign of strong stocks is their capacity to trade close to 52-week highs. Innoviva's last price of $22.96 is within 9% of its 52-week high of $25.15, well inside the Template's rule of being within 25% of the high. At the same time, the price is almost 39% above its 52-week low, showing a large recovery movement is already active.
- Relative Strength: Market strength is measured by relative strength (RS). Innoviva has an RS ranking above 75, meaning it has done better than about three-quarters of all stocks over the past year. This meets the Template's limit and indicates the stock is drawing more money than similar companies.
This technical view is important because it shifts the study away from personal speculation. The Trend Template clearly finds stocks where supply and demand forces are positive, institutional funds are probably entering, and the easiest direction is upward. It removes weak, consolidating, or falling stocks to concentrate only on those already in a strong Stage 2 rise.
Fundamentals Supporting High Growth Momentum
While a solid chart is necessary, Minervini states that the largest winners are nearly always backed by outstanding fundamental results. The second section of the screening process checks "High Growth Momentum," which looks at the speed and quality of a company's financial expansion. Innoviva's recent financial reports show several very high measures that match this growth-centered thinking.
- Very High Earnings Growth: The most notable numbers come from recent quarterly earnings. The company's Earnings Per Share (EPS) jumped by 5,300% year-over-year in its last reported quarter. The previous quarter also showed large growth of 240%. This sharp increase in profit is a main feature looked for by growth investors.
- Solid Sales Growth: Revenue growth is also present. Revenue grew by over 20% in the last quarter, and analyst predictions expect continued double-digit sales growth for the next quarter. This shows the earnings growth is not only from reducing costs but is backed by increasing business activity.
- Favorable Analyst Estimate Changes: Maybe one of the strongest confirmations of fundamental momentum is when analysts together increase their predictions. For Innoviva, the average EPS estimate for the next fiscal year has been raised by about 80% over the last three months. Such large upward changes often come before more institutional buying and price gains.
- High Profitability: The company's profit margin in the last quarter was very high at over 83%, showing an ability to turn revenue into earnings effectively.
These fundamental drivers are important because they give the "reason" for the stock's increasing price. Minervini's strategy suggests that stocks reaching new highs on solid fundamentals are not always priced too high but may instead be showing a better future view. The mix of a technically ideal chart and fundamentally very high quarters creates a strong situation where price movement and business results support each other.
Technical Condition and Current Position
According to ChartMill's own analysis, Innoviva receives a top-level Technical Rating of 10 out of 10, showing very good overall condition. The report says both long-term and short-term trends are positive, and the stock is trading in the higher part of its yearly range. The summary states, "INVA has proven to be a steady performer, scoring decent points in every aspect analyzed."
However, the same report gives a note of warning for immediate entry, giving a lower Setup Quality score. It shows that while the trend is very good, recent price action has been "a little bit too volatile to find a nice entry and exit point" and proposes waiting for a period of stability to present a lower-risk entry chance. This points out a key part of the strategy: finding a strong candidate is only the first step; acting at a careful point with clear risk is what divides screening from good trading. A complete view of the support, resistance, and trend study is in the detailed technical report.
Finding Similar Opportunities
Innoviva shows an example of a stock that fits the ideas of trend-following and growth momentum investing. For investors wanting to use this systematic method to discover other possible candidates, the screening process that found INVA can be a beginning. You can look at current market ideas that meet similar technical and fundamental growth rules via this High Growth Momentum + Trend Template screen.
Disclaimer: This article is for informational and educational purposes only. It does not form investment advice, a suggestion, or an offer to buy or sell any security. The study is based on given data and shows conditions at a specific moment. Investors should do their own complete research and think about their personal financial position and risk tolerance before making any investment choices. Past results are not a guide for future results.