
A common challenge for investors is finding companies with solid basic business momentum that are also at a price-chart moment suitable for market entry. One method to manage this is to search for stocks displaying solid basic growth and sound finances, while also showing price-chart formations that indicate a possible rise from a time of sideways movement. This method tries to match a company’s demonstrated operational power with a positive price formation, trying to spot chances where good basic qualities might be close to being acknowledged by the wider market.
One stock that recently appeared from such a search method is INNODATA INC (NASDAQ:INOD), a data engineering company centered on artificial intelligence software and services. The company offers AI data preparation, model training, and specific systems for areas including healthcare and media.
Basic Strength: The Source for Growth
The central idea of a growth investment method is to spot companies increasing their earnings and revenue at a speed faster than similar companies. INNODATA’s basic picture, as described in its ChartMill Basic Analysis Report, shows a business in a strong growth stage. The company receives a high overall Growth Rating of 9 out of 10, fueled by outstanding measures:
- Very High Revenue Growth: Revenue rose by 47.64% over the last year, with a multi-year average yearly growth rate of 34%. Future projections stay positive, with analysts predicting yearly revenue growth of about 32%.
- Positive Earnings Path: While past EPS growth has been uneven, the forward view is positive, with predicted yearly EPS growth of almost 38%.
- High Profitability and Soundness: Importantly, this growth is not harming financial steadiness. INNODATA has a Profitability Rating of 8, with notable returns on assets (19.09%) and invested capital (26.17%) that place in the best group of its Professional Services industry. Supporting this is a very good Financial Soundness Rating of 9, backed by a solid balance sheet with little debt and good cash availability.
These basic traits are necessary for the method. Solid growth shows market need and expansion ability, while high profitability and financial soundness indicate the growth can continue and the company is stable, lowering investment risk.
Price Assessment and Chart Situation
The search standards recognize that high-growth companies often have high price assessments. INNODATA’s Price Assessment Rating of 2 shows this, with a Price-to-Earnings ratio much higher than both industry and market averages. For growth investors, a higher price can be acceptable if the company’s growth speed is high enough and lasting, a place where INNODATA’s forward estimates give some explanation.
The chart situation, as seen in the ChartMill Chart Analysis Report, gives the second vital part. While the stock’s overall chart rating is low because of its place below important long-term average lines, the short-term formation shows a more detailed chance.
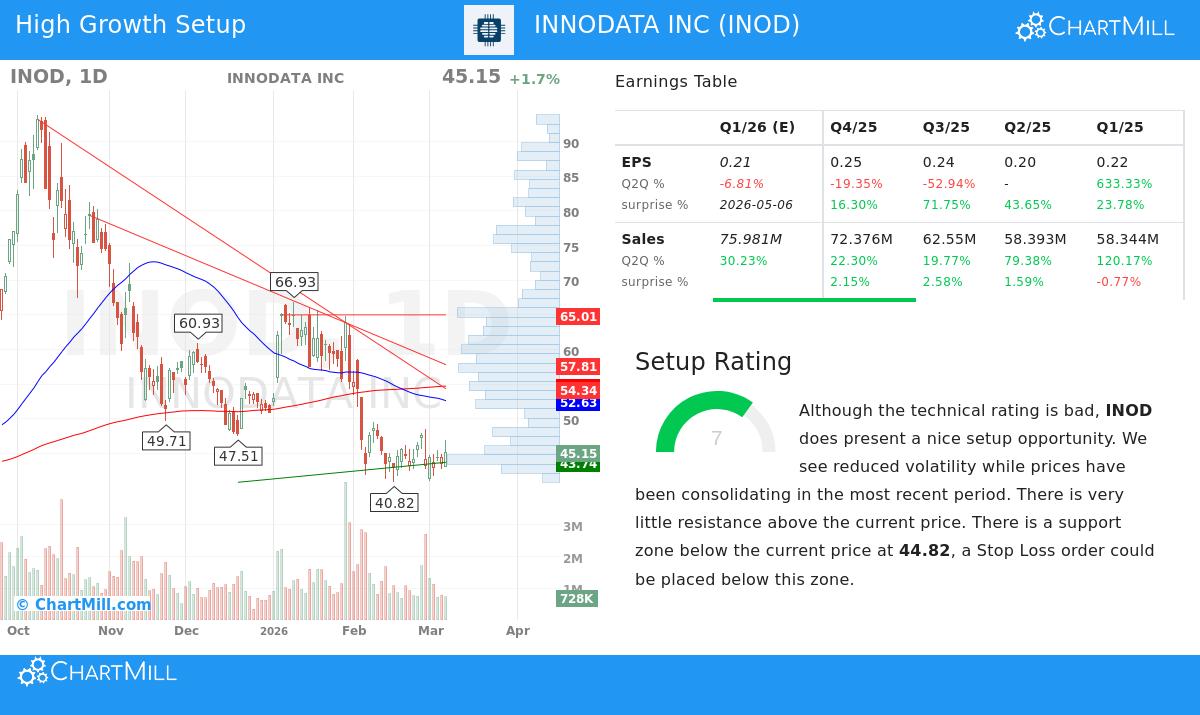
- Sideways Movement and Lower Price Swings: After a large drop from its 52-week peak, the stock has been moving in a sideways range between about $41 and $50 over the last month. This time of lower price swings after a downward trend can sometimes come before a new price direction.
- A Clear Formation Pattern: ChartMill gives a Setup Rating of 7 to INOD, marking this sideways movement as a possible foundation. The analysis states "lower price swings while prices have been moving sideways" with "very little price barrier above the current price." A clear support area is seen near $44, giving a possible guide for risk control.
- Market Difference: It is important to state that INOD is trading in the lower part of its yearly range, while the wider S&P 500 is near peaks. This difference can sometimes point out missed chances if the company’s basic qualities start to cause a price reassessment.
Why the Pairing is Important
The search method is strong because it looks for meeting points. INNODATA is not only a company with solid basic qualities, nor is it only a chart showing a foundation pattern. It is both. The basic report gives the "reason", a positive story of fast growth in the AI data field with very good financial performance. The chart formation gives the "timing", a chart shape that suggests the stock may be gathering force for its next move, having found a level of balance after a decline.
This meeting aims to remove "value traps" (low-priced stocks with no momentum) and "failed growth stories" (past leaders in steady drop), focusing instead on companies where basic momentum might be ready to show in price movement.
Locating Related Chances
INNODATA shows the kind of chance a paired chart and basic search can find. For investors wanting to use this method to locate other possible choices, the ready-made search for Solid Growth Stocks with positive Chart Setup Ratings is ready to use and adjust.
Disclaimer: This article is for information and learning only and is not investment guidance, a suggestion, or a bid to buy or sell any securities. The study shown is based on data and reports from ChartMill and should not be the only ground for any investment choice. Investing in stocks includes risk, including the possible loss of the amount invested. Past results do not guarantee future results. Always do your own complete study and think about talking with a registered financial advisor before making any investment choices.