
For investors looking to join strict technical rules with fundamental growth trends, the method made famous by Mark Minervini gives a clear system. This system, called the Specific Entry Point Analysis (SEPA), depends on finding stocks that are in strong, clear uptrends and also supported by improving business results. The aim is to find market leaders near the start of their big price moves by using two checks: the technical "Trend Template" to check price strength and momentum, and fundamental checks to confirm the company's profit and sales growth. This combination of technical and fundamental force is what marks a likely, strong-growth momentum situation.
INDEPENDENT BANK CORP/MA (NASDAQ:INDB) serves as an example for this joined review. As a bank holding company for Eastern Massachusetts and Southern New Hampshire, its latest results indicate it may be fitting the standards looked for by growth-focused investors using this system.
Technical Base: Following the Trend Template
The Minervini Trend Template gives a strict technical list meant to sort for stocks in a clear Stage 2 uptrend. INDB seems to fit these important standards, which are needed to make sure an investor is buying into strength, not trying to buy a declining stock.
- Price Above Important Moving Averages: The stock's present price trades well above its rising 50-day, 150-day, and 200-day simple moving averages (SMAs). This order shows continued buying across short, medium, and long-term periods.
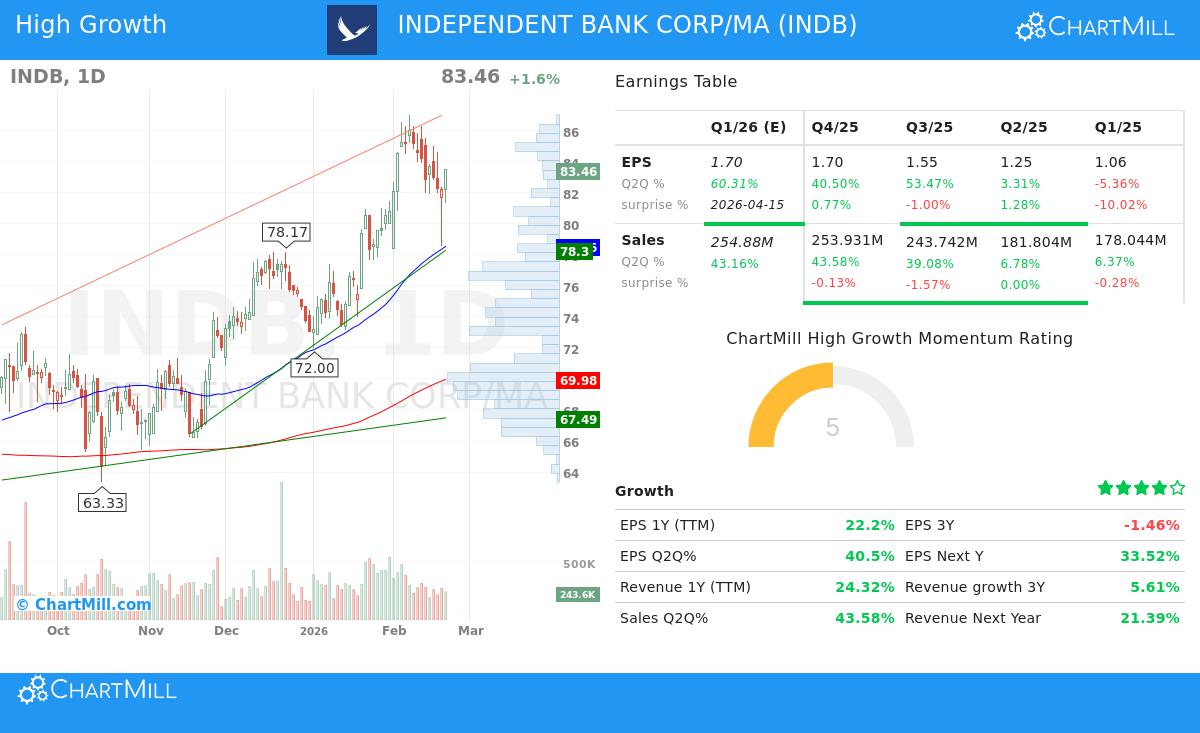
- Positive Moving Average Order: The 50-day SMA ($78.56) is above both the 150-day ($72.11) and 200-day ($69.98) SMAs, and the 150-day SMA is also above the 200-day. This upward order checks the uptrend's soundness and building momentum.
- Nearness to Highs: A central idea of the plan is to concentrate on strength. INDB's price is within 25% of its 52-week high of $87.00, showing it is joining the market's rise, not falling behind. At the same time, it stays more than 30% above its 52-week low, checking a major recovery trend is active.
- Strong Relative Strength: With a ChartMill Relative Strength (CRS) score of 77.61, INDB is doing better than most of the wider market. Minervini notes that real market leaders usually show RS scores above 70, often moving into the 80s or 90s, as large investors move money into the strongest stocks.
Fundamental Momentum: The Reason for Growth
While the Trend Template checks the "how," fundamental review explains the "why" for the price action. For a stock to be viewed for strong-growth momentum investing, it must show forceful and often building profit and sales growth. INDB's latest financial numbers point out several good points.
- Strong Earnings Growth: The company's trailing twelve-month (TTM) EPS growth is at a notable 22.2%. More importantly, the latest quarterly EPS jumped 40.5% year-over-year, with the quarter before showing an even stronger 53.5% growth. This sequence of major recent building is a key sign large investors look for.
- Strong Sales Growth: Revenue growth tells a like story. TTM revenue is up 24.3%, driven by a large 43.6% year-over-year gain in the last reported quarter. This top-line growth gives a firm base for continued earnings ability.
- Positive Estimate Changes: Analyst opinion is a useful checking sign. While next-year EPS guesses have seen a small downward change, revenue guesses for the next year have been changed upward by 0.57% over the past three months, hinting the basic business force is seen.
- Steady Results: The stock has met or passed earnings guesses in two of the last four quarters. While the average beat percentage is slightly negative, the strong absolute growth rates may be getting more notice than small differences from guesses.
Technical Condition and Situation Review
Beyond the basic Trend Template, a wider technical review gives background for possible entry points. According to ChartMill's own review, INDB gets a high Technical Rating of 9 out of 10, showing very good overall technical condition. Both its long-term and short-term trends are rated as positive, and it is doing well in its sector.
The review notes the stock is now trading in the higher part of its 52-week range and has lately shown a bull flag shape, a consolidation shape that often comes before a continuation of the earlier uptrend. This fits with the Minervini plan's focus on finding lower-risk entry points inside a current trend. The report finds a clear support area between $78.30 and $78.56, which could work as a sensible place for a stop-loss order, a key part of the plan's risk control.
For a full look at the support and resistance levels, volume trends, and full technical notes, readers can see the complete Technical Analysis Report for INDB.
Conclusion
INDEPENDENT BANK CORP/MA shows how the Minervini-style system tries to find chances. The stock meets the strict technical needs of the Trend Template, checking it is in a clear uptrend with good relative results. Fundamentally, it shows the kind of building profit and sales growth that can drive and maintain such a trend, making it an option for strong-growth momentum investors. The mix hints the price strength is supported by getting better business basics, a strong pair for possible continued good performance.
Want to find like options? The filter that found INDB joins Minervini's Trend Template with a High Growth Momentum filter. You can run this filter yourself and see the present results by going to the High Growth Momentum + Trend Template Screener.
,
Disclaimer: This article is for information and learning only. It is not meant as investment advice, a suggestion, or an offer to buy or sell any security. The review is based on given data and described methods, which have built-in risks. Investors should do their own research and talk with a qualified financial advisor before making any investment choices. Past results do not show future outcomes.