
For investors who use charts and price action, the search for promising opportunities often involves finding stocks that are both technically sound and ready for a move. One methodical way to do this is using a breakout strategy that selects for stocks showing solid underlying trends and narrow consolidation patterns. This approach tries to capture the next upward part of a stock's rise by entering as it moves out of a time of low volatility, giving a clear entry point and a specific level for managing risk. The aim is to locate securities where the technical condition is verified, and the situation presents a good balance of risk and potential reward.
A recent search using this approach has pointed to IMAX CORP (NYSE:IMAX) as a candidate that deserves more examination from a technical viewpoint. The entertainment technology company, recognized for its large-format film technology and content solutions, seems to be creating a pattern that frequently comes before notable price movement.
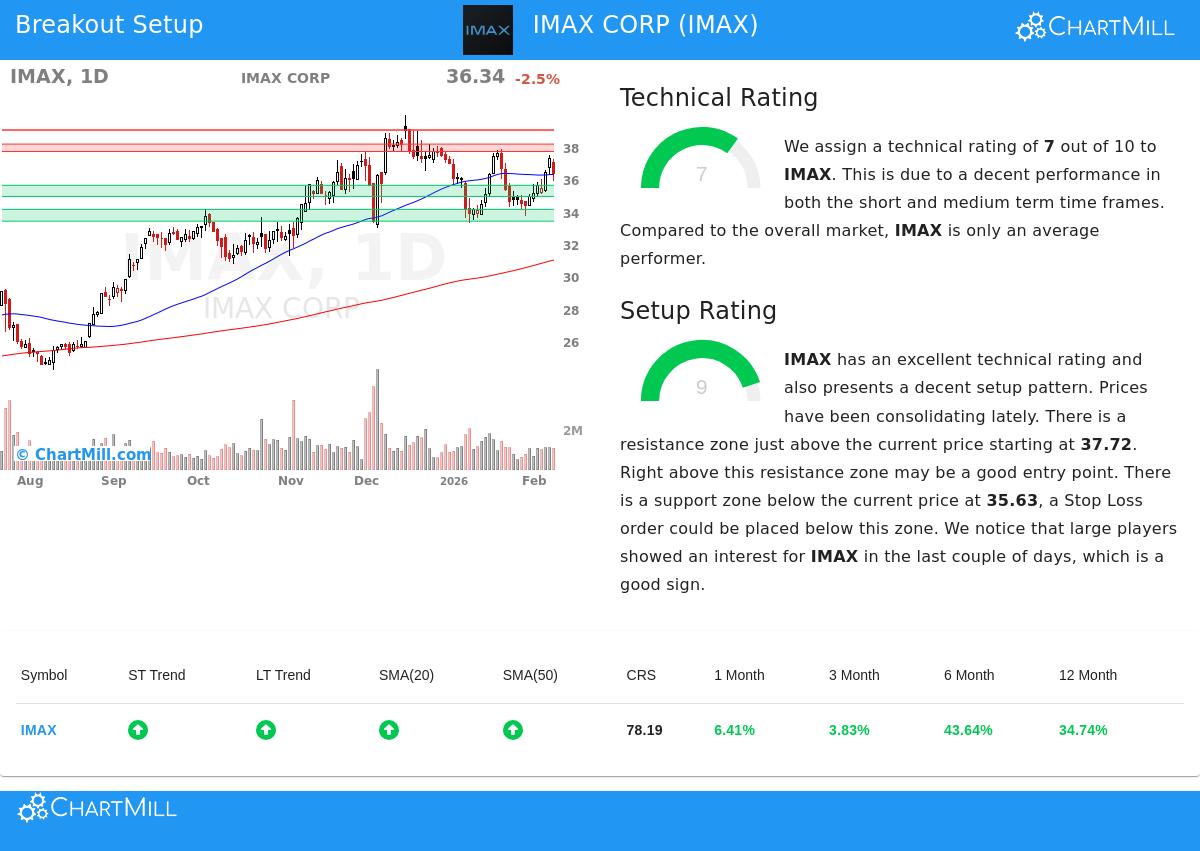
Looking at the Technical Base
The first part of this breakout strategy is verifying a stock's underlying technical condition. A good base indicates the stock is in a lasting uptrend and is more probable to continue a breakout effort. Based on the detailed ChartMill Technical Report for IMAX, the stock receives a Technical Rating of 7 out of 10. This score shows a good technical position formed on several important points:
- Positive Trend Agreement: Both the long-term and short-term trends for IMAX are scored as positive. This agreement across different time periods is a good indicator, showing continued buying pressure instead of a temporary rise.
- Good Relative Performance: While the wider S&P 500 trades near highs, IMAX is doing well in its own group. It currently does better than 82% of stocks in the Entertainment industry and 78% of all stocks in the market, showing clear relative strength.
- Helpful Moving Averages: The stock is trading above its important moving averages (20, 50, 100, and 200-day), and all these averages are in upward arrangements. This "stacked" agreement of moving averages is a typical feature of a sound uptrend.
This mix of points answers the central question of "which stock?" by marking IMAX as an issue with confirmed bullish momentum, making it a fitting candidate for a breakout strategy centered on trending names.
Judging the Setup Condition
A solid trend by itself is not a signal to buy; timing the entry is key. The second part of the strategy involves finding a high-condition setup, a period of consolidation or "narrow" trading that often gathers energy for the next directional move. This is where IMAX especially attracts notice, having a very good Setup Rating of 9 out of 10.
The high score shows the stock has been trading in a specific range lately, which helps set clear reference points for traders:
- Specific Trading Range: Over the last month, IMAX has consolidated between about $33.62 and $37.85. Trading in the center of this range suggests the stock is forming a base, with specific borders for support and resistance.
- Clear Resistance and Support: The technical report notes a near-term resistance area between $37.72 and $38.18. A clear move above this area could indicate the beginning of a new upward part. On the other side, a firm support area exists between $34.94 and $35.63, giving a reasonable place to set a protective stop-loss order.
- Large Player Interest: Another good point from the report is seen interest from big participants in recent days, which can sometimes come before more notable price movement.
This high-condition setup directly answers the "when to buy?" question. It presents a situation where a trader can specify an exact entry point (a move above resistance), a clear failure point (a move below support), and therefore, a measurable risk on the trade.
A Possible Trade Plan
Built on this technical and setup examination, an example trading plan appears. It is important to note this is an explanatory example taken from the reported levels, not a suggestion.
- Suggested Entry: A buy order could be set just above the noted resistance area, around $38.19, confirming a breakout is happening.
- Suggested Stop-Loss: To control risk, a stop-loss order could be placed just below the main support area, around $34.93.
- Risk Measures: This plan would mean a risk of about $3.26 per share, or 8.5% from the entry point. For a portfolio-level risk management method, this means assigning about 11.7% of capital to reach a 1% total portfolio risk on the trade.
Final Thoughts
For technical investors, IMAX presents an interesting example of a stock that fits the two needs of a sound trend base and a high-condition, practical setup. Its positive trend agreement and industry-leading relative strength give the bullish background, while its narrow consolidation near resistance offers a clear and quantifiable chance. As usual, such setups need watching for a confirmed breakout and should be thought about together with fundamental points and general market state.
Want to find more technical breakout chances? You can use the same screening method with the Technical Breakout Setups screen to see a new list of candidates each day.
Disclaimer: This article is for informational purposes only and does not constitute financial advice, a recommendation, or an offer or solicitation to buy or sell any securities. The trading example provided is purely illustrative and automated. All investments involve risk, including the possible loss of principal. Always conduct your own research and consider your individual financial circumstances and risk tolerance before making any investment decisions.