
For investors who use technical analysis to find possible trades, a common method looks for stocks that are both technically sound and ready for a move soon. This frequently involves searching for equities showing a clear, ongoing rise but are now in a period of little movement, giving a specific entry point with controlled risk. One organized way to do this is using specialized ratings like those from ChartMill, which measure a stock's technical condition and the state of its present pattern. A high Technical Rating points to a solid, continuing upward trend, while a high Setup Rating shows the stock is moving in a narrow band, possibly gathering force for its next upward move. Using these filters together can find interesting breakout possibilities in the market.
A recent search using this approach has identified International Business Machines Corp (NYSE:IBM) as a stock deserving more attention from a technical viewpoint. The company, a long-established leader in IT services and hybrid cloud solutions, seems to be displaying agreement between its business progress and a favorable price chart.
Reviewing Technical Condition
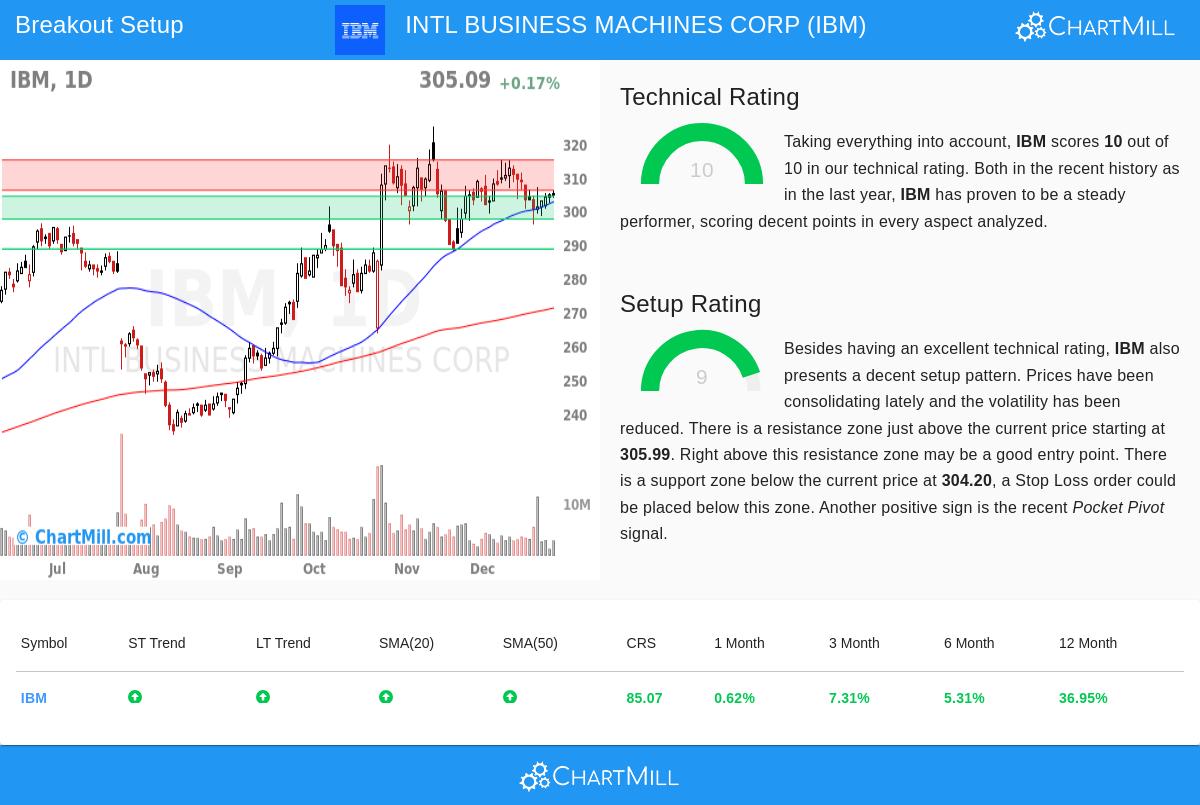
The base of a breakout method is a stock with built-in technical condition; there is little reason to buy a breakout if the wider trend is poor or falling. IBM's technical picture is very firm, receiving a top ChartMill Technical Rating of 10 out of 10. This number combines several time periods and measures to judge the stock's technical soundness.
A close look at the full technical report shows the reasons for this high rating:
- Trend Agreement: Both the recent and longer-term trends for IBM are seen as positive, a strong pairing that indicates momentum favors buyers across different time frames.
- Sound Relative Performance: The stock is doing better than 85% of the wider market over the last year and is in the top 17% of its IT Services industry group. This means the price movement is not only due to a climbing market but shows particular condition.
- Moving Average Backing: The stock is priced above all its important simple moving averages (20, 50, 100, and 200-day), and each of these averages is itself in an upward pattern. This forms a tiered structure of support under the price.
- Firm Support Areas: The study finds five separate support areas below the present price, with the closest and strongest group going from about $297 to $304. This multi-level support gives clear levels for controlling risk.
Judging the Setup State
A sound trend is needed, but not enough, for a good trade. The best entry happens after a time of limited movement within that trend, which is what the Setup Quality rating seeks to find. IBM gets a 9 out of 10 here, showing a high-grade setup pattern is present.
The present chart activity confirms this rating:
- Limited Movement in a Rise: Over the last month, IBM has moved in a band between about $295.70 and $315.35. After a solid multi-month climb, this time of sideways action is a normal pause, letting the stock absorb its increases.
- Specific Resistance and Nearness: The limited movement is happening just below a noted resistance area between $305.99 and $314.99. Trading close to resistance in a narrow band raises the chance of a clear breakout if buyers can gather sufficient strength.
- Lowered Volatility & Favorable Signs: The report states that volatility has lessened during this stage, a typical feature of a setup ready to move. Also, a recent "Pocket Pivot" sign—a price move supported by volume suggesting buying—was seen, adding a favorable detail to the setup.
A Possible Trade Plan
Based on this technical picture, a specific plan appears. The method would be to wait for a confirmed breakout above the immediate resistance, using the nearby support as a guide for risk control.
- Possible Entry: A buy stop order could be set at $315.00, just above the resistance area, to confirm the breakout has force.
- Possible Exit (Stop Loss): A stop loss order could be placed at $297.42, just under the main support area. This would cap the theoretical loss on the trade to about 5.6%.
- Risk Setting: For a portfolio manager planning to risk 1% of total funds on this idea, the trade size could be set to about 17.9% of the portfolio.
It is very important to know this is only a technical, pattern-focused example. It does not include fundamental news, coming earnings reports (set for April 23rd), or wider market changes. The S&P 500's present favorable trends give a supporting environment, but investors must always do their own full study.
This review of IBM shows the usefulness of combining trend and setup filters to find opportunities. For investors wanting to see other stocks now fitting similar technical breakout conditions, new options can be found each day using the Technical Breakout Setups screen.
Disclaimer: This article is for information only and is not investment advice, a suggestion, or an offer or request to buy or sell any securities. The trade plan described is a theoretical example built on technical analysis and should not be seen as a certain result. All investing and trading has risk, including the possible loss of the original amount. Always do your own research and think about talking with a qualified financial advisor before making any investment choices. Past results do not predict future outcomes.