
Investors looking for possible breakout chances often use systematic screening methods to find stocks that are both technically sound and ready for a move. One method uses two specific metrics: the ChartMill Technical Rating, which judges the overall condition and direction of a stock, and the ChartMill Setup Quality Rating, which judges the quality of its current consolidation pattern. The aim is to find stocks with solid basic trends (a high Technical Rating) that are also moving in a tight range, hinting a possible breakout is near (a high Setup Rating). This method removes stocks that are either trending poorly or are too stretched to give a good risk-reward entry.
A recent scan using this method has pointed to Helmerich & Payne (NYSE:HP) as a candidate needing more examination from a technical view. The oil and gas drilling contractor's stock seems to be showing the traits that technical traders often look for when preparing for a possible upward move.
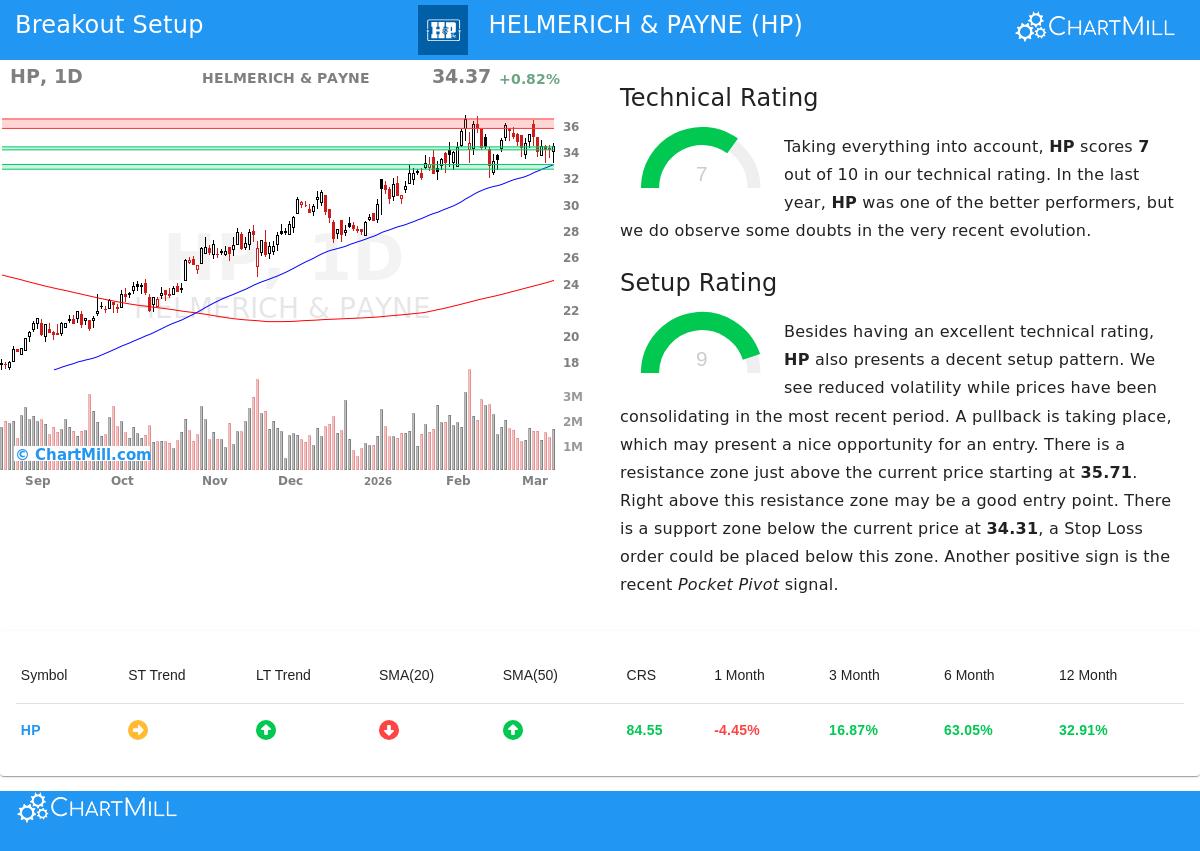
Technical Health Assessment
The base of a breakout strategy is a stock with firm basic momentum. The ChartMill Technical Rating for HP is a 7 out of 10, showing a stock in a confirmed uptrend. This score is important because it hints the wider market forces are positive; a breakout from a consolidation in a stock already in an uptrend has a better chance of continuing than one in a downtrend.
A closer look at the full technical report shows the details behind this rating:
- Trend Structure: The long-term trend is called positive, while the short-term trend is neutral. This mix often comes before a continuation of the main trend once the short-term consolidation ends.
- Relative Performance: Over the last year, HP has been a good performer, doing better than about 84% of all stocks in the market. This better relative strength is a main part of a high Technical Rating, as it shows the stock is a market leader.
- Moving Average Alignment: The stock is trading above its key rising moving averages (50, 100, and 200-day), which is a classic sign of a good uptrend and gives a structure of dynamic support.
Setup Quality and Consolidation Pattern
While a strong trend is needed, it is not enough for a best entry. A stock must also give a low-risk chance, which is where the Setup Quality Rating becomes key. HP scores a very good 9 out of 10 on this metric. A high setup score shows that the stock has been trading in a tight range with lowering volatility, gathering energy for its next directional move.
The technical report lists the specific conditions that make this high-quality setup:
- Recent Price Action: Over the last month, HP has traded in a range between about $31.94 and $36.63. It is currently consolidating in the middle of this range, which the analysis notes "may present a good entry opportunity."
- Defined Support and Resistance: The report finds clear, multi-timeframe support close to the $34.31 level and resistance starting around $35.71. These set boundaries let traders exactly calculate risk (the distance to support) and reward (the distance to resistance or a new high).
- Positive Signal: A recent "Pocket Pivot" signal was seen, which is a volume-backed price pattern often read by technical analysts as a sign of institutional accumulation during a consolidation phase.
The Possible Breakout Situation
The mix of a positive long-term trend (Technical Rating of 7) and a tight, well-defined consolidation (Setup Rating of 9) prepares for a possible breakout. The automated analysis suggests a possible trading setup with an entry just above the current price, around $34.49, and a protective stop loss just below the found support zone near $34.07. This would set a very tight risk parameter of about 1.2% on the trade.
For the breakout to be confirmed, traders would usually look for a convincing move above the nearby resistance zone starting at $35.71, ideally on higher-than-average volume. Such a move could show the end of the consolidation phase and the start of the next leg higher within the set long-term uptrend.
Finding More Chances
The screening process that found Helmerich & Payne is run daily to discover new possible breakout setups as market conditions change. Investors interested in seeing the current list of stocks that meet similar standards of strong technicals and high-quality setups can find them through the Technical Breakout Setups screen.
Disclaimer: This article is for information only and does not make investment advice, a suggestion, or an offer to buy or sell any security. The analysis is based on technical metrics and automated reports. All trading and investment decisions involve risk, including the possible loss of principal. Past performance is not a guide to future results. Readers should do their own research and talk with a qualified financial advisor before making any investment decisions.