
In the field of growth investing, joining a solid technical system with firm fundamental momentum can be an effective method for spotting possible leaders. One technique that shows this is the approach made known by trader Mark Minervini, which depends on his Specific Entry Point Analysis (SEPA). This system methodically mixes a fixed technical list, the Trend Template, with attention on firms displaying quickening earnings and sales growth. The aim is to find stocks that are both in a verified uptrend and supported by fundamental gains that can drive more price increase. This two-step method tries to capture good performers early in their growth periods while controlling risk using exact entry and exit guidelines.
HAMILTON INSURANCE GROUP LTD-CL B (NYSE:HG) recently appeared through a scan made to find such chances. The scan used Minervini's Trend Template to confirm technical force and combined it with a High Growth Momentum (HGM) rating filter to separate firms with strong fundamental growth paths. This pairing tries to find securities that are technically set for continuation and fundamentally able to maintain it.
Technical Fit with the Minervini Trend Template
A central idea of the Minervini method is to buy in the direction of the main trend, steering clear of the errors of trying to buy a declining stock. The Trend Template gives a clear, rule-based system to spot stocks in a sound Stage 2 rise. For HG, the present technical view shows a good fit with these rules, which is key for verifying the stock is being bought and in a positive stage.
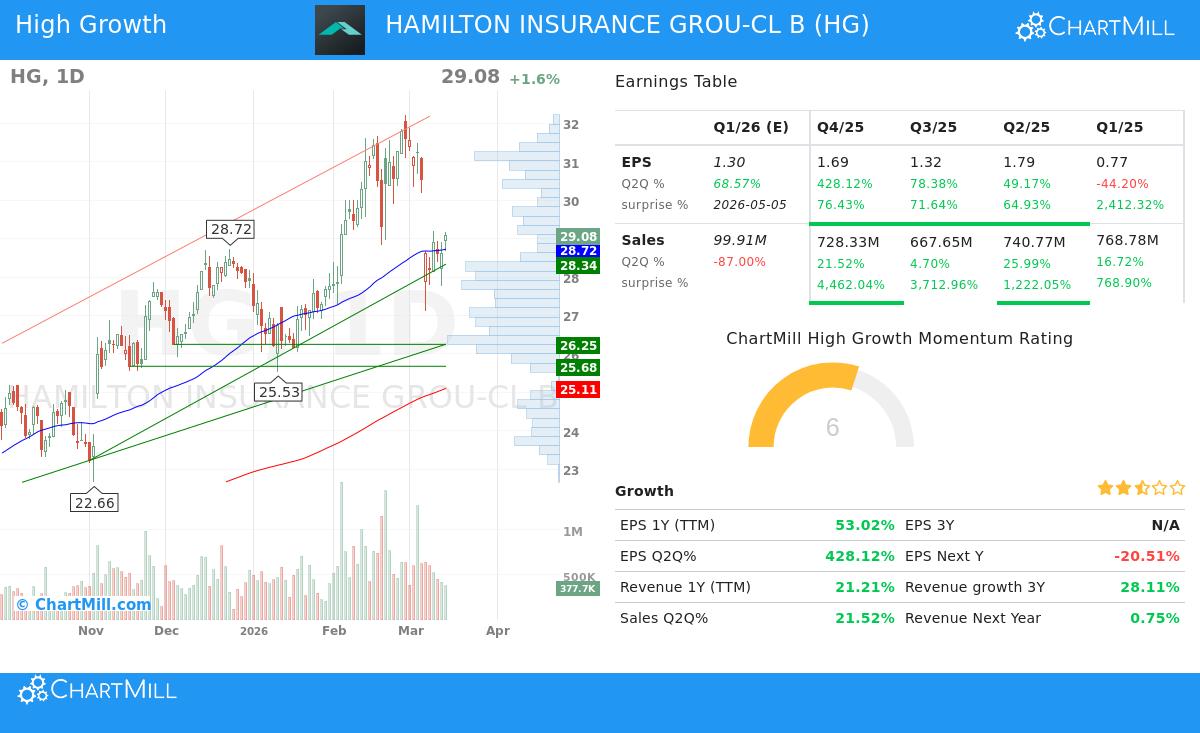
- Moving Average Arrangement: The stock's price ($29.08) trades above its main long-term moving averages (150-day at $26.37 and 200-day at $25.11), and these averages themselves are in upward arrangements. Also, the nearer-term 50-day moving average ($28.72) is above both the 150-day and 200-day averages. This layered, upward arrangement of moving averages is a classic Minervini need, showing continued buying across several time frames.
- Nearness to Highs: HG is now trading within 10% of its 52-week high of $32.21, well inside the Trend Template's rule of being within 25% of the high. At the same time, the stock is about 73% above its 52-week low, well past the 30% minimum limit. This shows major upward momentum from its lows while still keeping force near top levels.
- Relative Strength Performance: With a ChartMill Relative Strength (CRS) score of 85.51, HG is doing better than about 85% of all stocks in the market. Most significantly, it does better than 94% of its group in the Insurance industry. Minervini stresses that real market leaders show high relative strength, as it points to institutional choice and money moving into the stock before the wider market.
Fundamental Momentum for Growth Investors
While the Trend Template deals with the "when," the "why" of a continued move often rests in the fundamentals. The High Growth Momentum part of the scan centers on firms showing quickening business results, a key piece of Minervini's SEPA method which looks for stocks with a fundamental "driver." HG's recent financial numbers show several positive growth signs.
- Earnings Quickening: The company's earnings per share (EPS) growth has shown notable recent quickening. Year-over-year EPS growth for the past twelve months is at a solid 53%. More significantly, the growth in the latest quarter jumped by over 428% compared to the same quarter last year. This type of fast quarterly earnings growth is just what growth investors and systems like SEPA search for as a possible driver.
- Steady Earnings Beats: HG has topped analyst EPS estimates in each of the past four quarters, with an average beat of over 656%. This steady history of beating forecasts builds trust with investors and can lead to positive changes and new ratings.
- Good Profitability Directions: The company's profit margin in the last reported quarter was 23.6%, showing a gain from the previous quarter's 20.7%. A growing margin shows operational efficiency and pricing ability, which can greatly increase bottom-line growth even as revenue rises.
- Firm Revenue Growth: Top-line growth supplies the base for earnings. HG's revenue growth over the past year is a sound 21.2%, with the latest quarter growing at 21.5% year-over-year. This shows demand for its insurance and reinsurance services is growing firmly.
Technical Condition and Setup Review
Beyond the fixed Trend Template list, a wider technical study gives setting for possible entry points. According to ChartMill's own report, HG is given a firm Technical Rating of 7 out of 10. This rating shows a steady overall result and a positive long-term trend, confirming the stock's place as a technically sound candidate.
The report states, however, that the short-term trend has lately turned negative, and the stock's Setup Quality rating is medium at 5. This implies that while the long-term bases are strong, the price movement has been somewhat changeable in the near term, missing a tight, clear consolidation shape that would give a low-risk entry point. For investors using a Minervini-style method, this points out the need for patience, waiting for the stock to steady and form a proper volatility contraction pattern (VCP) or other constructive base before thinking about an entry would match the method's discipline.
You can see the full, detailed technical analysis for HG, including support and resistance levels, here: HG Technical Analysis Report.
Finding Like Chances
HAMILTON INSURANCE GROUP LTD-CL B gives a study of a stock that fits the strict technical filters of a tested trend-following method while also showing the fundamental growth traits wanted by momentum investors. Its fit with the Minervini Trend Template gives a technical aid, while its quickening earnings and good profitability give a fundamental reason for continued attention.
For investors looking for other picks that match this mix of technical force and high-growth momentum, you can run the same scan using this link: High Growth Momentum + Trend Template Screen.
Disclaimer: This article is for information and learning only. It is not a suggestion to buy or sell any security. The analysis is based on given data and certain scanning systems, which have built-in limits. Investing includes risk, including the possible loss of principal. You should do your own research and talk with a qualified financial advisor before making any investment choices.