
For investors aiming to join strict technical rules with an emphasis on fundamental growth, the method created by Mark Minervini offers a strong framework. This process, called the Specific Entry Point Analysis (SEPA), methodically finds stocks showing both strong price trends and speeding business results. The strategy uses the Minervini Trend Template as a technical checkpoint, making sure a stock is in a clear, long-term uptrend before review. It then adds strict fundamental filters to find companies showing outstanding and frequently getting better growth in earnings, sales, and profit. This two-part review tries to catch market leaders early in their large price increases.
A present instance that meets this strict filter is HEICO Corp.-Class A (NYSE:HEI.A), a top maker of aerospace and electronic parts.
Technical Base: Following the Trend Template
The first part of the Minervini strategy is a stock's technical condition, judged through the Trend Template. This template needs a particular order of moving averages and price movement to confirm a stock is in a lasting Stage 2 rise. Using the given data, HEICO shows a firm technical position that fits these rules:
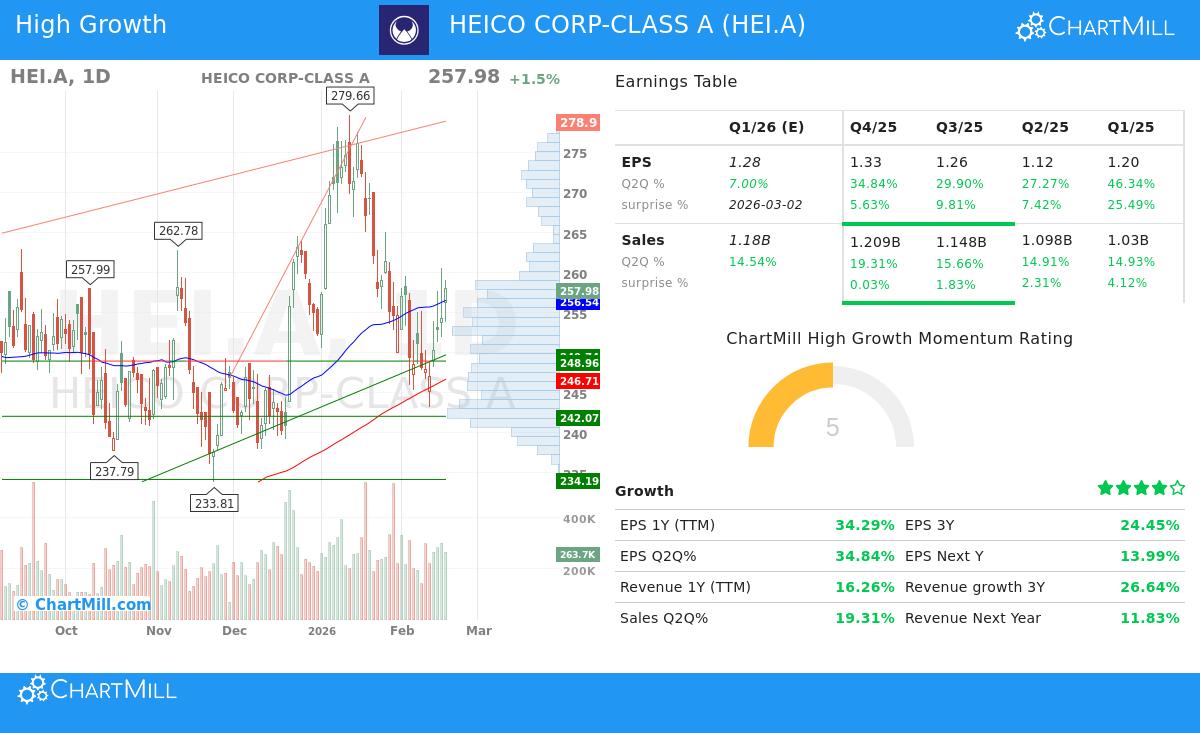
- Price Above Important Averages: The present price of $257.98 trades above its rising 50-day ($256.54), 150-day ($251.04), and 200-day ($246.71) simple moving averages (SMAs). This order is vital, as it shows the stock is in a set uptrend across all main timeframes.
- Upward-Moving Long-Term Trends: Both the 150-day and 200-day SMAs are in clear upward paths, a fixed rule for Minervini that confirms the long-term trend's condition.
- Correct Moving Average Order: The 50-day SMA is positioned above both the 150-day and 200-day SMAs, while the 150-day SMA is above the 200-day SMA. This "stacked" order shows steady and increasing buying pressure.
- Nearness to Highs: The stock trades about 41% above its 52-week low of $180.36 and within about 8% of its 52-week high of $279.66. Minervini highlights concentrating on strength, preferring stocks that are showing force and recovering firmly from lows, instead of looking for large discounts at lows.
- Firm Relative Strength: With a ChartMill Relative Strength (CRS) score of 81.62, HEICO does better than over 81% of the market. High relative strength is a sign of market leadership, showing the stock is drawing money even when wider indexes may be struggling.
This combination of technical points indicates HEICO is in a managed, long-term uptrend, exactly the type of setting the Minervini strategy tries to use for high-probability situations.
Fundamental Driver: The Argument for Strong Growth
Meeting the technical screen is only the initial stage. The Minervini idea states that the largest stock market winners are nearly always backed by outstanding and speeding fundamental results. HEICO’s recent financial numbers show a profile that fits the "strong growth momentum" wanted by this strategy.
The company is showing not just growth, but a speed increase in key profit numbers:
- Earnings Force and Speed Increase: HEICO's trailing twelve-month (TTM) EPS is at $4.91, showing a year-over-year growth of 34.3%. More significantly, the quarterly force is firm. The newest quarter showed EPS growth of 34.8% year-over-year, after earlier quarters of 29.9% and 27.3% growth. This pattern of firm, following quarterly growth is a main feature Minervini searches for, as it often comes before large institutional interest.
- Steady Earnings Surprises: The company has exceeded analyst EPS estimates in each of the last four quarters, with an average beat of 12.1%. Steady positive surprises can lead analysts to raise future estimates, creating a reason for more price gains.
- Growing Profitability: Beyond top-line growth, getting better margins show operational excellence and pricing ability. HEICO's profit margin in the last quarter was 15.57%, showing an improvement over the margin from two quarters before (14.28%). Rising margins on growing sales can lead to fast earnings growth.
- Good Revenue Growth: Sales growth stays solid, with TTM revenue up 16.3% year-over-year and the latest quarter reporting a 19.3% increase. The company has also beaten revenue estimates for four straight quarters.
This mix of firm earnings growth, positive surprises, and margin growth forms the fundamental "story" that, when joined with a sound technical trend, creates the possibility for notable stock performance.
Technical Review and Situation
ChartMill’s own analysis gives a combined view of HEICO’s present technical status. The stock gets a firm Technical Rating of 8 out of 10, reflecting its firm overall trend condition and market-relative performance. The report states the long-term trend is positive, though the short-term trend has lately become neutral as the stock settles some of its gains.
This settling is shown in a Setup Rating of 6. The analysis finds a clear support area between $254.78 and $256.54, made by a mix of important moving averages and trendlines. For a trader using the Minervini method, such a set support area after a rise is important, as it allows for the planning of lower-risk entry points if the stock continues its uptrend. The full technical report, which lists support and resistance levels, volume trends, and moving average analysis, can be seen here: HEICO Technical Analysis Report.
Closing
HEICO Corp. shows an example in fitting with a strict growth and momentum strategy. It satisfies the strict technical rules of the Minervini Trend Template, confirming its place in a long-term uptrend with firm relative strength. Fundamentally, it shows the signs of a strong-growth company, with speeding earnings, steady beating of expectations, and getting better operational efficiency. While past results do not promise future outcomes, this mix of technical firmness and fundamental speed increase is exactly what methods like SEPA are made to find.
Want to find other stocks that meet similar strong-growth and technical trend rules? You can inspect the preset screen that found HEICO and discover more possible choices by going to the High Growth Momentum + Trend Template Screener.
,
Disclaimer: This article is for information and learning only. It is not a suggestion to buy or sell any security. The review is based on given data and certain method structures. Always do your own complete research, think about your personal money situation, and talk with a qualified financial advisor before making any investment choices. Past results do not promise future outcomes.