
Investors looking to find high-potential stocks often join careful technical study with basic growth measures. One organized way to do this is the Mark Minervini plan, which uses a defined Trend Template to find equities in clear uptrends. This process sorts for stocks showing firm price momentum, agreement of important moving averages, and better relative strength. To better focus the search for strong growth potential, this technical filter can be joined with a High Growth Momentum (HGM) score, which looks at a company's earnings and sales speed, profit margin directions, and analyst estimate changes. This two-part method tries to separate companies that are not only technically good but also showing basic business speed.
A Firm Technical Base: The Minervini Trend Template
A central idea of the Minervini plan is to invest following a clear trend, staying away from the problems of trying to buy a declining stock. The Trend Template gives a clear list to make sure a stock is in a certain Stage 2 rise. HASBRO INC (NASDAQ:HAS) now shows agreement with these important technical points:
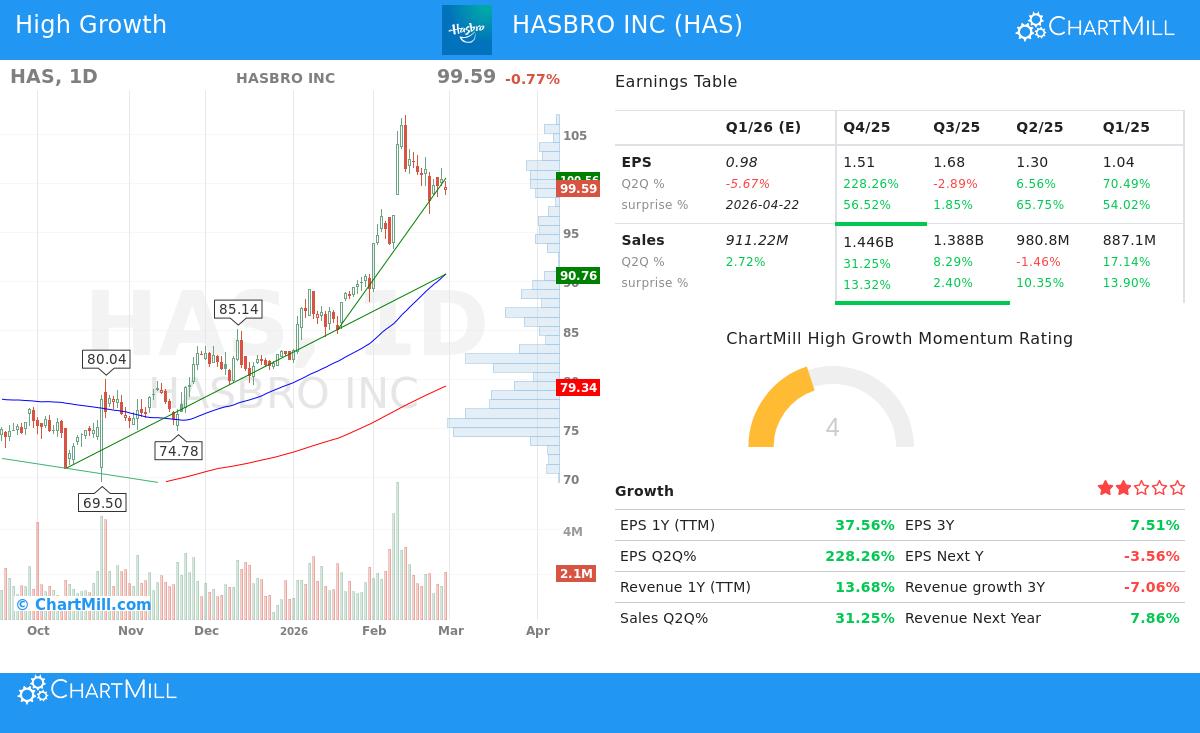
- Moving Price and Moving Averages: The stock's last price of $99.59 trades well above its rising 50-day ($90.78), 150-day ($82.12), and 200-day ($79.34) simple moving averages. Also, the 50-day average is above both the 150-day and 200-day averages, and the 150-day is above the 200-day. This order is a classic sign of a firm, multi-timeframe uptrend.
- Nearness to Highs: The current price is within 7% of its 52-week high of $106.98, meeting the template's need to be within 25% of the high. At the same time, the price is more than 100% above its 52-week low of $49.00, well past the 30% minimum. This shows strong recovery momentum.
- Market Leader Position: With a ChartMill Relative Strength (CRS) score of 87.94, Hasbro is doing better than nearly 88% of all stocks in the market. High relative strength is a key trait of market leaders, which often keep doing better.
This combination of factors indicates Hasbro is in a sound, continuing uptrend, meeting the technical conditions Minervini stresses for lowering risk and taking part in a stock's firmest rises.
The Driver for Growth: Basic Momentum
While a firm chart is necessary, the Minervini plan looks for the basic "driver" that can push a stock forward. The High Growth Momentum score checks this by studying earnings, sales, and profit trends. Hasbro's recent financial results show several good signs:
- Earnings Speed: The company has shown clear earnings strength. Quarterly EPS growth year-over-year was a notable 228% in the newest quarter. While this comes after a quieter prior quarter, the company has passed EPS estimates in each of the last four quarters by an average of over 44%.
- Sales Growth Return: After a time of revenue decrease, top-line growth has come back. Year-over-year sales growth was over 31% last quarter, and the trailing twelve-month revenue growth is nearly 14%. This return to growth is a key good signal.
- Getting Better Profit and View: The profit margin in the last quarter was a sound 13.94%. Maybe more importantly, analyst view is getting better, the average estimate for next year's earnings has been moved up by 1.34% over the last three months, hinting at growing belief in the company's path.
These parts, speeding earnings, returning sales, and good estimate changes, are exactly what the HGM score and the basic part of the Minervini SEPA (Specific Entry Point Analysis) method try to find. They suggest the improving technical price action is backed by real business progress.
Technical Soundness and Setup Review
Beyond the simple Trend Template, a wider technical study gives background for possible entry points. According to ChartMill's own analysis, Hasbro gets a top-level Technical Rating of 10/10, showing very good soundness across short and long-term timeframes. The long-term and short-term trends are both seen as good, and the stock is doing better than 90% of its peers in the Leisure Products industry.
The study also notes a Setup Rating of 7/10. This shows the stock is in a time of consolidation or pullback inside its larger uptrend, with lower volatility. Such times can offer chances for new entries. The technical report finds a near-term resistance zone around $100.56-$100.61 and key support levels near $90.76-$90.98 and $85.13-$85.50.
For a full look at the support, resistance, and trade setup analysis, you can see the complete ChartMill Technical Report for HAS.
Finding Like Chances
Hasbro shows an example of a stock that agrees with a strict growth-and-momentum filtering process. For investors wanting to find other companies that meet like technical and basic growth points, the preset filter that found HAS can be a useful beginning point.
You can look at the current results of this "High Growth Momentum + Trend Template" filter here: View the Screening Results.
Closing
The study of Hasbro shows how joining Minervini's trend-following ideas with a focus on basic momentum can point out possible investment choices. The stock meets the strict technical list of the Trend Template, confirming its place in a firm uptrend. Also, its strong HGM score points to underlying business momentum, with speeding earnings, returning sales growth, and improving analyst view. While past results are never a promise of future results, this two-part method tries to systematically find stocks where good technical action is backed by basic improvement.
Disclaimer: This article is for information and learning only. It is not meant as investment advice, a suggestion, or an offer to buy or sell any security. The analysis is based on given data and should not be the only base for an investment choice. Investors should do their own study and talk with a qualified financial advisor before making any investment decisions. Please read our full disclaimer here.