
For investors who use charts and price action to guide their choices, a methodical way to find possibilities is important. One such technique looks for stocks that are both technically sound and building a favorable price pattern, a pairing that can point to a possible price advance. This method centers on two specific metrics: the ChartMill Technical Rating, which judges the general condition and direction of a stock, and the ChartMill Setup Quality Rating, which examines if the stock's present price action is creating a logical, lower-risk entry pattern. By selecting for stocks with good marks in both areas, traders try to find situations in prominent stocks that are set for their next upward move.
GSK PLC-SPON ADR (NYSE:GSK) now offers a notable example for this method, as described in its technical analysis report. The British pharmaceutical company, with its collection covering vaccines, specialty medicines, and consumer healthcare, is showing a solid technical picture along with a good-quality setup, marking it as a notable choice for more review by investors focused on technicals.
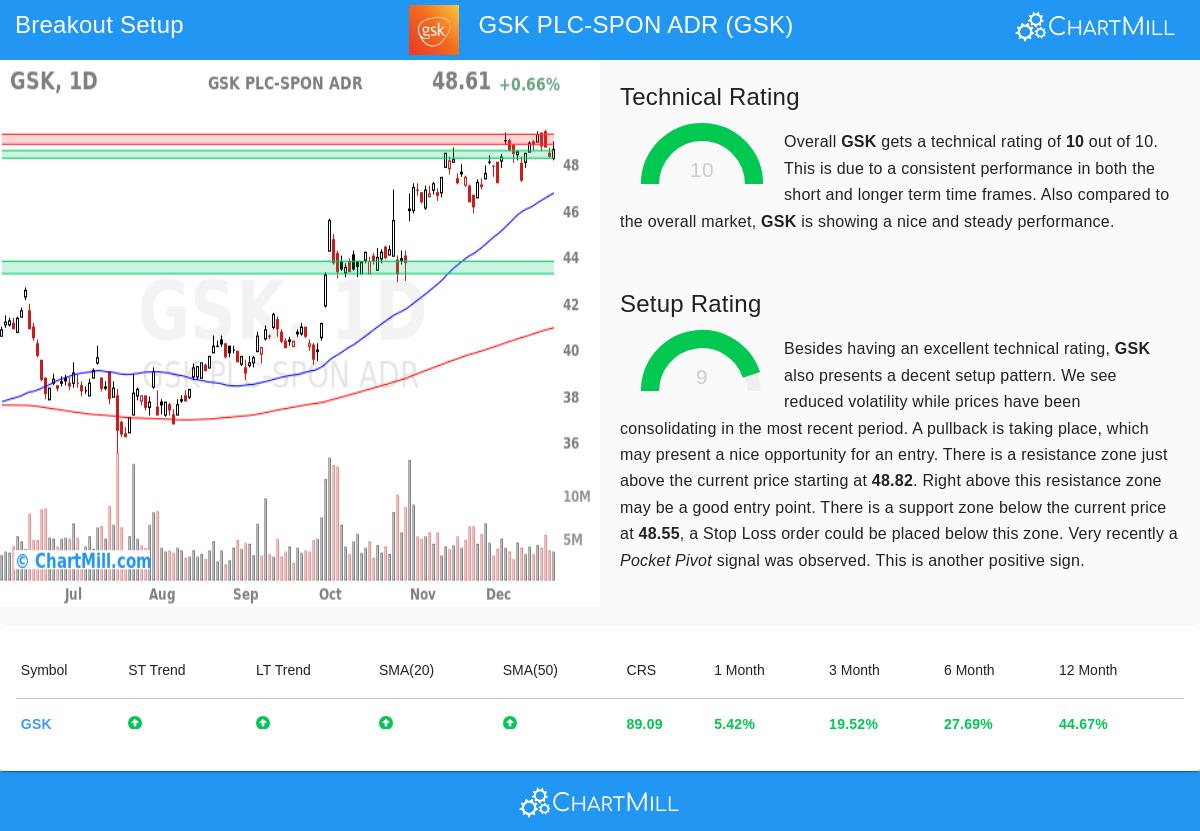
Technical Strength: The Basis of the Trend
The first part of the breakout method is finding stocks with fundamental technical strength, as a solid trend supplies the force required for a good breakout. GSK does well here, receiving a complete ChartMill Technical Rating of 10. This highest mark comes from several matching positive elements:
- Trend Agreement: Both the long-term and short-term trends for GSK are marked as good. This agreement across periods implies a continued and sound upward movement instead of a brief recovery.
- Good Relative Performance: During the last year, GSK has done better than 89% of all stocks. This strong relative performance shows it is a market frontrunner, a trait frequently wanted in breakout possibilities.
- Price Level and Moving Averages: The stock is trading close to its 52-week high, a usually positive indicator. Also, its price is above all important moving averages (20, 50, 100, and 200-day), and each of these averages is in a rising pattern. This layered agreement of support levels is a standard feature of a sound upward trend.
This mix of elements confirms the central idea of the method: concentrating on stocks already in a verified uptrend. A high Technical Rating removes weak or stationary stocks, making sure an investor examines choices with demonstrated momentum, which is exactly what GSK shows.
Setup Quality: Finding the Entry Point
A solid trend by itself is not a sign to purchase; entering at a high price can cause quick declines. The second part of the method is the Setup Quality Rating, which finds periods of consolidation inside the larger trend, providing a possible lower-risk entry point. GSK gets a 9 here, meaning a very good setup.
The analysis observes that GSK has been moving sideways in an area between about $46.47 and $49.44 over the last month, with the present price trading in the center of this area. This time of lower volatility and lateral movement after a previous rise is the "coiling" that often comes before a new breakout. Important parts of the setup include:
- Specific Support and Resistance: The report notes a clear support area between $48.22 and $48.55, made by a combination of trendlines and moving averages. Just above the present price, a resistance area is between $48.82 and $49.25.
- A Specific Trade Plan: The good setup quality allows for a definite, rule-based plan. The proposed setup involves placing a buy-stop order just above the resistance area at $49.26, waiting for the stock to show it can pass this barrier. A stop-loss order would be placed just below the support area at $48.21, specifying and capping the risk on the trade.
- Additional Signs: The report also mentions a recent "Pocket Pivot" sign, a volume-based pattern that implies buying by bigger investors, giving more support to the favorable price action.
This high Setup Rating specifically answers the "when" to buy, giving a structure for entry that depends on the stock's own price formation instead of speculation. It tries to enter as the stock continues its confirmed uptrend, using the recent consolidation as a base.
Conclusion and Next Steps
GSK’s pairing of a complete Technical Rating and an almost-complete Setup Rating makes it a clear example of what the Technical Breakout screen is made to find. It shows a leading stock, in a solid uptrend, that has stopped to consolidate its progress and could be getting ready for its next upward movement. The specified support and resistance levels give a clear plan for entry and risk control.
It is very important to recall that no technical setup assures a win. Investors should always think about fundamental elements, like upcoming company results or sector events, and make sure any trade fits their own risk comfort and investment plan. The automatically created entry and exit points are sample cases based on the closest technical levels; some investors might choose broader stops for a longer-term position.
For investors wanting to find comparable technical setups each day, the Technical Breakout Setups screen regularly sorts the market for stocks showing high technical and setup marks.
,
Disclaimer: This article is for information only and is not investment advice, a suggestion, or an offer to buy or sell any security. The analysis shown is based on technical measures and should not be the only reason for an investment choice. All investing has risk, including the possible loss of the amount invested. Always do your own research and think about talking with a qualified financial advisor before making any investment choices.