
GENERAL MILLS INC (NYSE:GIS) has been identified as a Technical Breakout Setup Pattern by our stock screener. This pattern typically occurs when a stock takes a pause after a significant rise, indicating the possibility of a continuation in the trend. While it's impossible to predict with certainty, it might be beneficial to monitor NYSE:GIS.
What is the technical picture of NYSE:GIS telling us.
As part of its analysis, ChartMill provides a comprehensive Technical Rating for each stock. This rating, ranging from 0 to 10, is updated on a daily basis and is based on the evaluation of various technical indicators and properties.
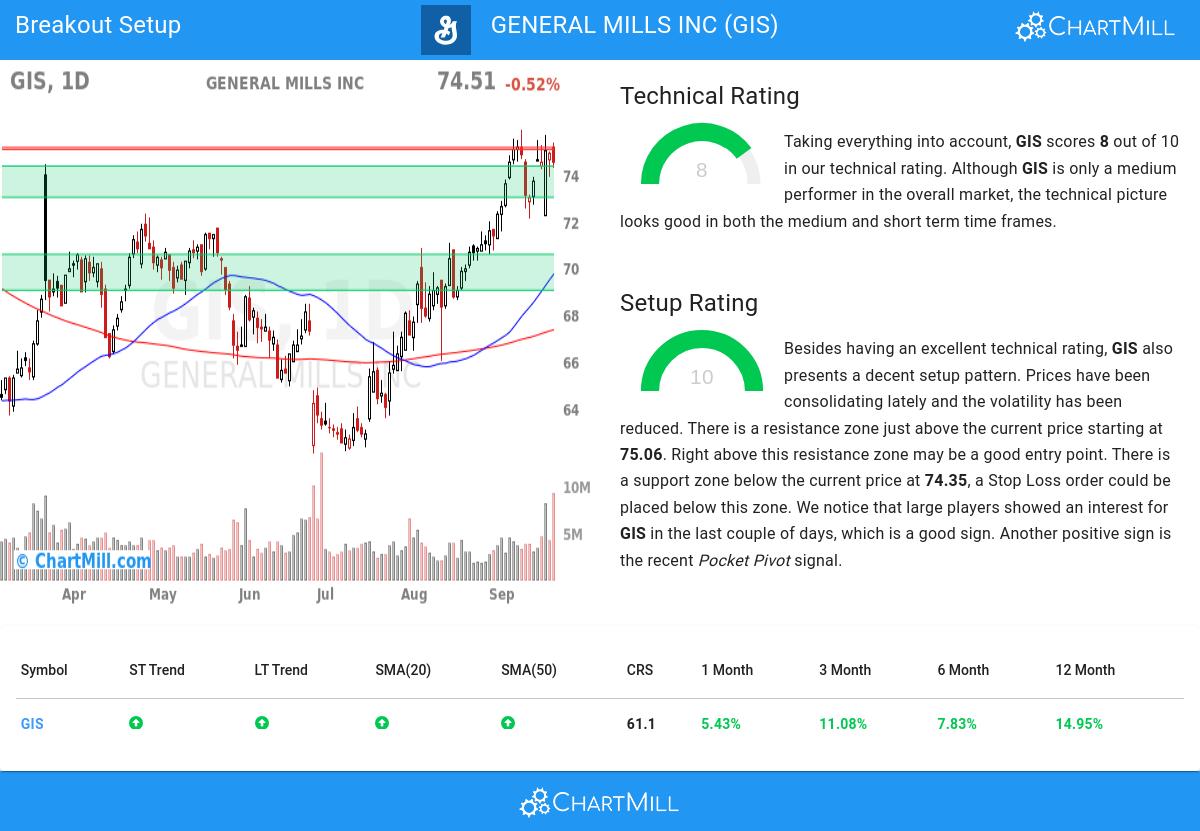
Overall GIS gets a technical rating of 8 out of 10. Although GIS is only a medium performer in the overall market, the technical picture looks good in both the medium and short term time frames.
- The long and short term trends are both positive. This is looking good!
- GIS is part of the Food Products industry. There are 92 other stocks in this industry. GIS outperforms 71% of them.
- GIS is currently trading near its 52 week high, which is a good sign. The S&P500 Index however is also trading near new highs, which makes the performance in line with the market.
- GIS is currently showing a bull flag pattern! A bull flag pattern occurs when prices pull back slightly after a strong rise up. This may be a nice opportunity for an entry.
- Volume is considerably higher in the last couple of days, which is what you like to see during a strong movement up.
- When compared to the yearly performance of all other stocks, GIS outperforms 61% of them, which is more or less in line with the market.
For an up to date full technical analysis you can check the technical report of GIS
How does the Setup look for NYSE:GIS
Alongside the Technical Rating, ChartMill assigns a Setup Rating to evaluate the consolidation level of a stock. This rating, ranging from 0 to 10, is updated daily and considers various short-term technical indicators. The current setup rating for NYSE:GIS is 10:
Besides having an excellent technical rating, GIS also presents a decent setup pattern. We see reduced volatility while prices have been consolidating in the most recent period. There is a resistance zone just above the current price starting at 75.06. Right above this resistance zone may be a good entry point. There is a support zone below the current price at 74.35, a Stop Loss order could be placed below this zone. We notice that large players showed an interest for GIS in the last couple of days, which is a good sign. Very recently a Pocket Pivot signal was observed. This is another positive sign.
Trading breakout setups.
A breakout opportunity may arise when the stock surpasses the current consolidation zone and reaches new highs. Traders often wait for this breakout before considering buying the stock. To manage risk, a stop loss order could be placed below the consolidation zone to limit potential losses.
Disclaimer: This article is not intended to provide trading advice. It is crucial to conduct your own analysis and consider your own observations and trading style when making investment decisions. The article solely presents technical observations and should not be relied upon as a sole basis for trading.
More breakout setups can be found in our Breakout screener.
Keep in mind
Important Note: The content of this article is not intended as trading advice. It is essential to perform your own analysis and exercise caution when making trading decisions. The article presents observations created by automated analysis but does not guarantee any trading or investment outcomes. Always trade responsibly and make independent judgments.