
For investors using a technical breakout method, the goal is to find stocks that are in a firm, clear uptrend and are also taking a break to move sideways. This pause forms a possible entry area, letting traders get ready for the next upward move. The method depends on two main proprietary measures from ChartMill: the Technical Rating, which measures the general condition and trend force of a stock, and the Setup Quality Rating, which judges the condition of the present pause pattern. A stock with high marks on both measures is a notable technical breakout possibility.
GOLD FIELDS LTD-SPONS ADR (NYSE:GFI) is now a clear model of this arrangement, listed on our daily Technical Breakout Setups screen. The South African gold miner’s chart shows a forceful trend along with a positive pause, indicating it could be getting set for its next notable price change.
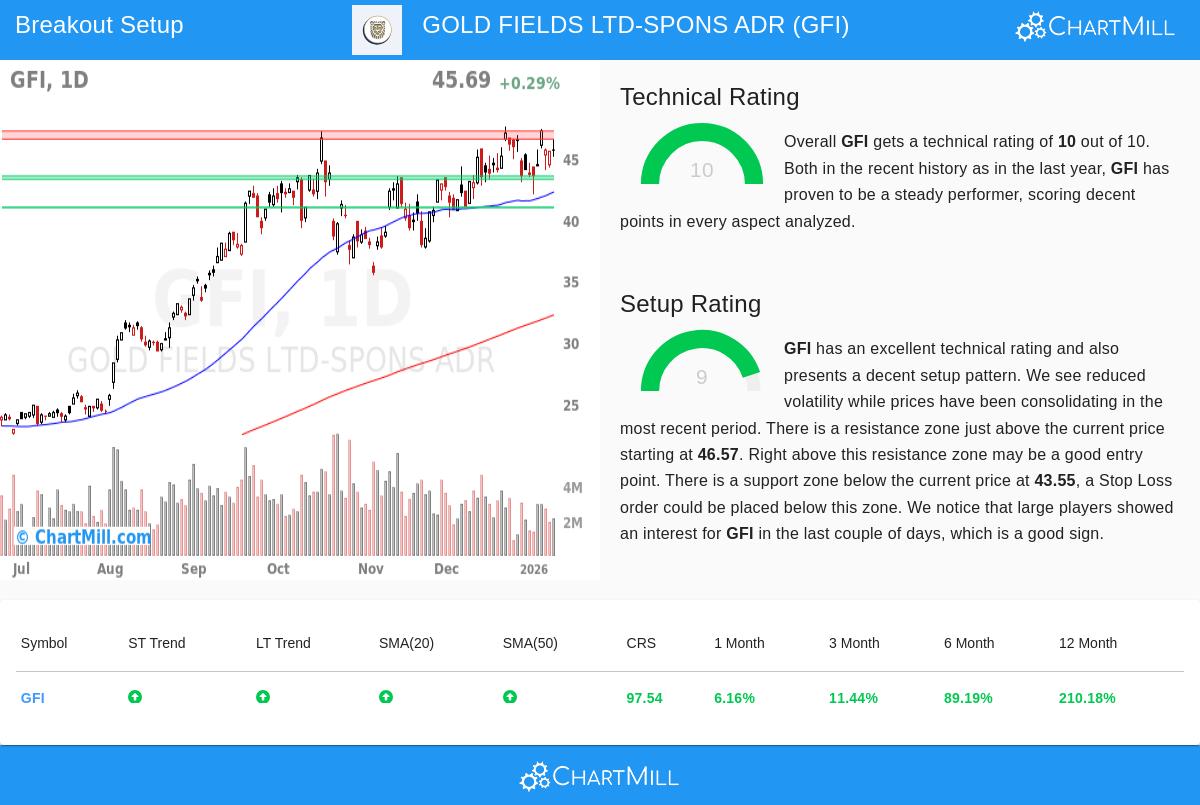
A Base of Notable Technical Force
The base of any breakout trade is a stock with firm basic momentum. GOLD FIELDS LTD-SPONS ADR is strong here, receiving a complete Technical Rating of 10 from ChartMill. This highest mark points to notable technical condition across several time periods. A close look at the full technical report shows the reasons for this rating:
- Forceful Uptrends: Both the near-term and longer-term trends for GFI are decidedly positive. This agreement is a key sign of continued buying force and an absence of notable selling.
- Market and Group Outperformance: The stock is doing better than 97% of the whole market over the last year and is in the top group of its Metals & Mining industry. This comparative force shows it is a frontrunner, not just gaining from a general market rise.
- Firm Moving Average Backing: The stock’s price is trading above all its main simple moving averages (20, 50, 100, and 200-day), and each of these averages is in a rising pattern. This layered agreement of support levels is a standard trait of a strong upward trend.
- Nearness to Highs: GFI is trading close to its 52-week high, confirming the force of the current rise.
For a breakout method, this outstanding Technical Rating is required. It answers the first key question: "Is this a stock worth buying?" A high rating makes sure the stock is in a verified uptrend, raising the chance that a breakout from a pause will continue in the expected direction.
A High-Condition Arrangement for a Possible Breakout
While a firm trend is necessary, buying at the correct time is also key to avoid entering a stretched position. This is where the Setup Quality Rating is used, answering the question of "When should I buy it?" GFI gets a high 9 on this measure, pointing to a high-condition pause pattern.
The technical report notes the traits that make this arrangement interesting:
- Pause Inside a Band: Over the last month, GFI has been trading between about $42.10 and $47.60. This time of lower volatility and sideways movement lets the stock absorb its earlier gains and form a new base of support.
- Clear Support and Resistance Marks: The pause has formed distinct borders. A notable support area is found between $43.28 and $43.55, made by a meeting of trendlines. On the other side, nearby overhead resistance is in an area from $46.57 to $47.23.
- Large Trader Activity: ChartMill’s analysis states that big participants have shown activity in GFI in recent days, as measured by the Effective Volume indicator. This can be a positive sign that knowledgeable money is gathering during the pause phase.
For a technical trader, this arrangement gives a clear plan. The resistance area above present prices sets a possible trigger point for a breakout entry. A clear move above this area could signal the restart of the main uptrend. The distinct support area below gives a reasonable place to set a protective stop-loss order, setting and limiting the trade’s risk from the start.
A Specific Trade Plan
From this study, ChartMill’s system creates a sample trade arrangement, showing how a technical trader might plan an entry. It proposes a Buy Stop order at $47.24, just above the resistance area, to confirm the breakout has momentum. A Stop Loss order at $43.27, placed below the support area, would control risk, leading to a possible loss of about 8.4% on the trade if activated. This example shows the disciplined, rule-based method that breakout strategies try to follow.
Locating Additional Breakout Possibilities
GOLD FIELDS LTD-SPONS ADR shows the kind of high-chance arrangement technical traders look for. For investors wanting to search the market each day for similar chances, the Technical Breakout Setups screen methodically filters for stocks with a Technical Rating of at least 7 and a Setup Rating of at least 7, giving a selected beginning point for more study.
Disclaimer: This article is for information only and is not investment advice, a suggestion, or an offer to buy or sell any security. The trade arrangement described is an automated, sample model for learning and is not a promise of future results. All investing and trading has risk, including the possible loss of principal. Always do your own study, think about your personal money situation and risk comfort, and talk with a qualified money advisor before making any investment choices. Past results do not show future outcomes.