
For investors who use charts and price action to guide their choices, the search for promising opportunities often comes down to two main questions: which stock is in a solid trend, and when is the best time to enter that trend? A methodical way to answer these questions includes looking for stocks that show both good technical condition and a positive price pattern, hinting a possible breakout may be near. This process selects for securities with a high technical score, confirming a solid existing trend, and a high setup quality score, pointing to a pause phase that could come before the next upward move.
One company now fitting these strict conditions is The Gap Inc (NYSE:GAP). The clothing seller has shown up on searches made to find technical breakout formations, hinting it may be ready for its next important price change. A close look at its technical details shows why it is notable from a chart analyst's view.
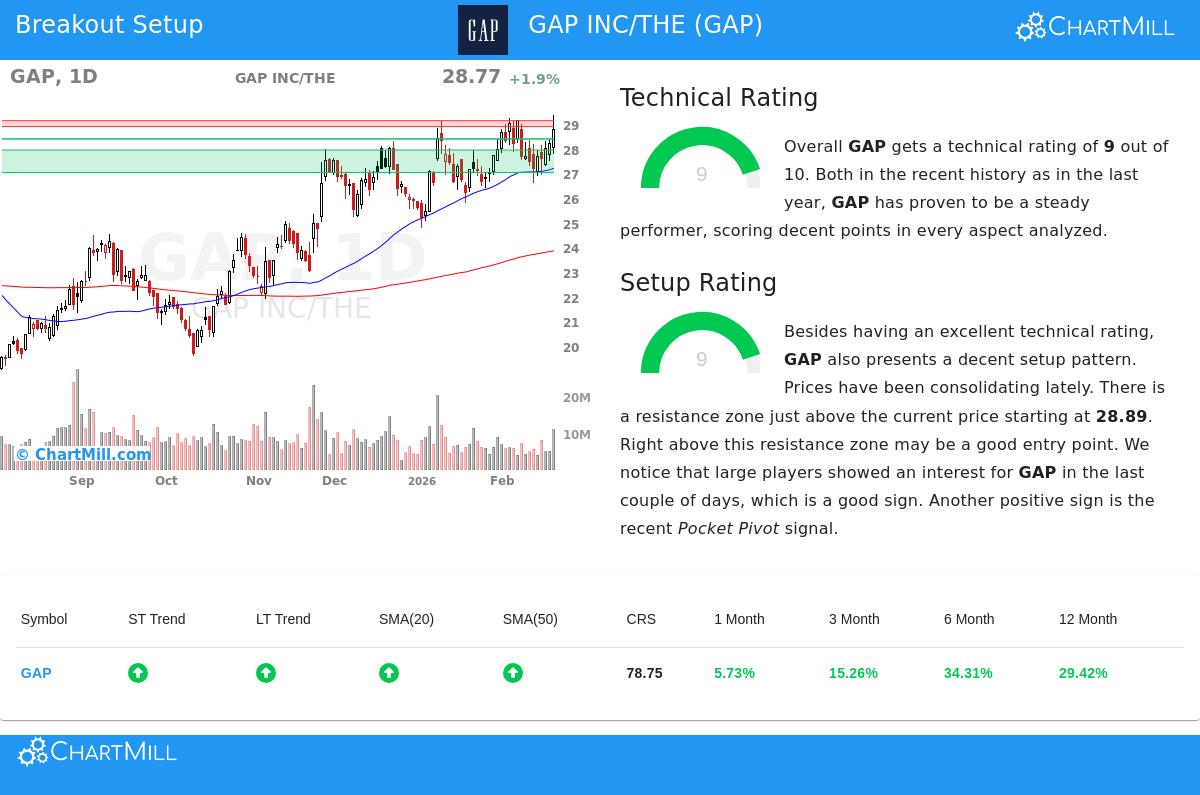
Solid Technical Base
The main step in a breakout search looks for stocks with solid and continuing momentum, as a forceful trend helps a trade. Gap’s technical score of 9 out of 10 puts it with the market's best from a chart viewpoint. This score is not given without reason; it shows steady force across many time periods and measures.
- Trend Agreement: Both the long-term and short-term trends for GAP are scored as positive. This agreement is a key sign of condition, showing buying force is leading across weekly and daily charts.
- Market and Group Position: The stock's results over the last year are better than 78% of the wider market. More notably, inside its competitive Specialty Retail field, it does better than 74% of its 123 similar companies, showing comparative force that often comes before more advances.
- Moving Average Backing: The stock price is above all its main simple moving averages (20, 50, 100, and 200-day), and each of these averages is in an upward pattern. This layered, positive arrangement shows a clear uptrend with established support points.
- New High Area: GAP is now trading close to a new 52-week high, a typical trait of stocks in strong uptrends. While the wider S&P 500 is also near highs, GAP’s group-leading comparative force suggests its move is especially strong.
This complete technical view, found in the full ChartMill Technical Report, answers the "which stock" question with certainty. It marks GAP as a technically healthy candidate working in a positive setting for trend extension.
A Top-Grade Setup for Entry
Finding a strong stock is only part of the task. The "when to buy" question is answered by the setup quality score, which looks for pause patterns that give a sensible, low-risk entry point. Gap gets a top-level setup score of 9, showing it is not only trending but also gathering force for a possible breakout.
- Pause Inside a Band: Over the last month, GAP has traded between $26.42 and $29.36. While this band is fairly broad, the price is now pausing near the top of the band, suggesting it is tightening just below a clear resistance area.
- Clear Resistance and Support: The study finds a specific resistance area between $28.89 and $29.13, made by joining trendlines. Just below the present price, a multi-level support area exists between $27.03 and $27.94. This makes a clear conflict zone: a breakout above resistance could mark a new upward move, while the nearby support gives a sensible area to set a protective stop-loss order.
- Supportive Market Action: The setup notes positive signs from market members, including attention from large traders (as seen by the Effective Volume measure) and a recent "Pocket Pivot" sign, a price/volume pattern that often points to gathering by knowledgeable investors.
This high-grade setup means the stock is not stretched too far; instead, it is halting after a strong move, letting momentum gather again and giving a defined level for traders to use. The pairing of a top technical score (9) and a top setup score (9) is exactly what the breakout search method is made to find.
A Specific Trading Plan
From this technical and setup study, a possible trade plan appears. The proposed entry point is a buy-stop order at $29.14, just above the found resistance area, which would start only if the stock moves to a breakout. A first stop-loss could be set at $28.38, just below the closest support, setting the trade's risk. It is very important to note this is an example made from the technical levels; traders should always change such details to match their own risk comfort and plan.
Finding Other Breakout Chances
Gap Inc. shows a clear example of how mixing technical condition with setup quality can find possible chances. For investors wanting to find other stocks that now match this strict breakout outline, new choices are found each day through the specific search tool. You can see the present list of technical breakout formations by going to the Technical Breakout Setups screen.
Disclaimer: This article is for information only and is not investment advice, a suggestion, or an offer or request to buy or sell any securities. The study shown is based on technical measures and should not be the only ground for any investment choice. All trading and investment choices include risk, including the chance of loss of original funds. Readers should do their own study and talk with a qualified financial advisor before making any investment choices. Past results do not show future results.