
For technical investors looking to find stocks ready for their next rise, a frequent method is to concentrate on market leaders that are pausing after gains. This method tries to seize momentum by buying a stock after a period of inactivity, as it starts a new upward move. A useful way to do this is by using filters that search for two important proprietary measures: a high ChartMill Technical Rating, which finds stocks in solid, confirmed uptrends, and a high ChartMill Setup Quality Rating, which finds those trading in narrow, positive formations that frequently come before a price move.
One stock now fitting these strict conditions is TechnipFMC PLC (NYSE:FTI), a top energy service company specializing in subsea and surface technologies for hydrocarbon production. Based on the most recent ChartMill Technical Analysis report, FTI shows a strong profile for traders searching for a good breakout possibility.
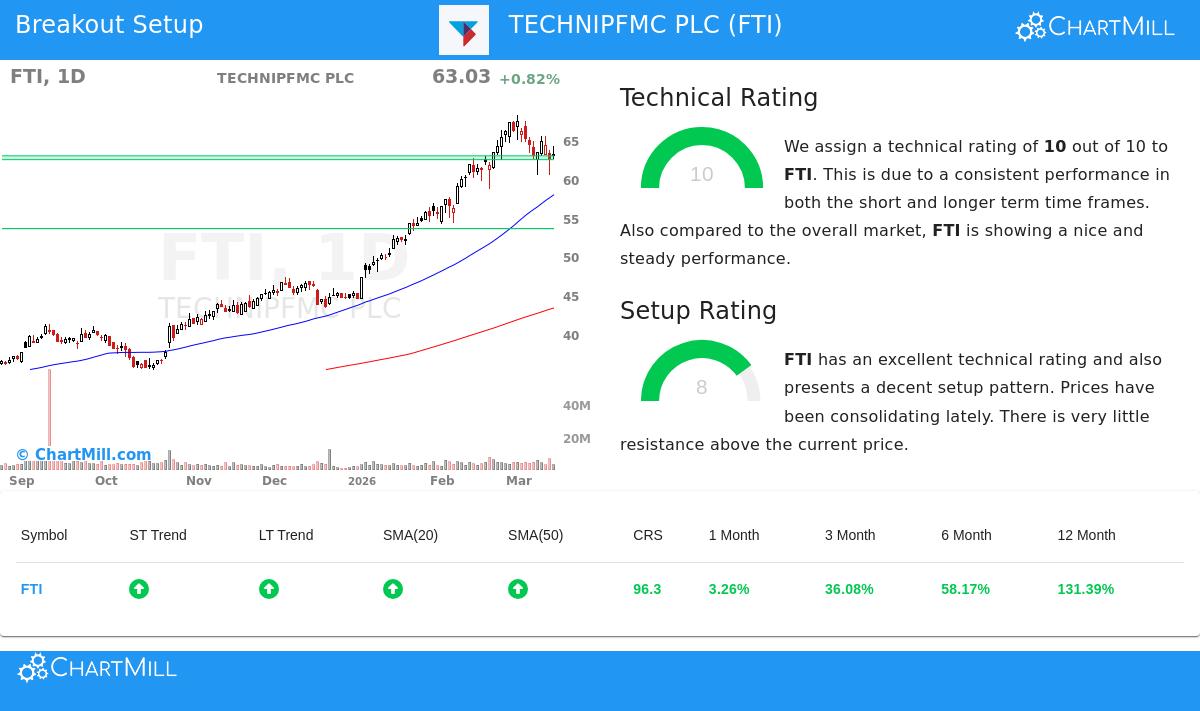
Notable Technical Condition
The base of a breakout method is a stock's basic technical condition. A high Technical Rating makes sure an investor is not trying to buy a declining stock but is instead joining with a current, strong trend. TechnipFMC does very well here, receiving a perfect Technical Rating of 10 out of 10. This best-possible score shows notable condition across many time periods and measures.
- Strong Trend Agreement: Both the long-term and short-term trends for FTI are scored as positive. This agreement across time periods is a typical indicator of a good, continuing rise.
- Leading Relative Performance: The stock's performance over one year puts it in the top 4% of all market stocks, indicating major outperformance. Also, it performs better than 86% of other companies in the Energy Equipment & Services industry, confirming it leads its sector.
- Solid Moving Average Backing: The stock is priced above all its main simple moving averages (20, 50, 100, and 200-day), and each of these averages is itself in an upward pattern. This layered, upward support formation is a key sign of a solid uptrend.
This mix of elements makes FTI a clear case of a market leader, which is the main "which stock?" filter in the breakout setup method.
A Good Setup Formation
While a solid trend is needed, it is not enough for a best entry. A stock that has risen quickly may be overstretched and ready for a decline. The Setup Quality Rating answers the "when to buy?" question by finding times of pause. FTI gets a Setup Rating of 8, meaning it is making a positive formation.
- Recent Pause: The technical report states that prices have been pausing recently. Over the last month, FTI has moved in a band between about $58.67 and $68.29. It is now trading in the middle of this band, suggesting it is forming a foundation.
- Defined Support and Little Price Resistance Above: The analysis finds several clear support areas below the present price, with the closest important area between $62.51 and $63.01. Significantly, the report says there is "very little resistance above the current price," which might allow for a clear upward path if a breakout happens.
- Nearness to Main Averages: The stock's present price is close to its rising 20-day moving average ($64.21), a signal it is not too far from short-term support, which adds to a positive setup score.
A Possible Trade Plan
From this analysis, the technical report proposes a possible trade plan. The idea follows the breakout method: buy on a price move that confirms the pause is finishing and the uptrend is continuing, with a stop loss set below the recent support area to control risk.
- Suggested Entry: A buy stop order at $64.47, set just above the 20-day moving average.
- Suggested Exit/Stop Loss: A stop loss order at $62.50, placed below the closest support area.
- Risk Measures: This sets a risk of about 3.06% on the trade. For a portfolio-level risk control method, the report figures that using 25% of funds for this position would mean a 0.77% total portfolio risk.
It is very important to see that this is an example made from the technical measures. The space between the entry and stop is fairly small compared to the stock's average daily range, so traders might want to change these levels based on their own risk comfort and study of the chart.
Locating Other Breakout Possibilities
TechnipFMC shows how joining solid technicals with a good setup can point out possible breakout candidates. This method can be used in a regular way to the wider market. For investors wanting to find other stocks now showing similar signs, new possible setups are found each day using the Technical Breakout Setups screen.
Disclaimer: This article is for information only and is not investment advice, a suggestion, or an offer or request to buy or sell any securities. The analysis and any trade examples use technical measures and are made automatically. They should not be seen as a promise of future results. Always do your own study, think about your personal money situation and risk comfort, and talk with a qualified financial advisor before making any investment choices. Trading stocks has risk, including the possible loss of your initial investment.