
For investors looking for chances where the market price may not completely show a company's basic strength, a disciplined screening method can be a helpful first step. One such way is to look for companies that show a mix of good fundamental condition and earnings, combined with what seems to be a low valuation. This idea fits with main value investing rules, which center on finding good businesses selling for less than their real value. The aim is to find possible deals where the market's negative view or mistake has made a price gap, giving a safety buffer for the patient investor.
A recent filter for "fair value" stocks, which looks for a good valuation mark together with fair marks for earnings, financial condition, and increase, has pointed out FLEX LTD (NASDAQ:FLEX). The worldwide manufacturing services company, recognized for its design, supply chain, and making skills in areas such as automotive, cloud systems, and medical care, seems to show an interesting picture for more review.
Valuation Measures: The Heart of the Chance
The main draw for a value-focused filter is FLEX's valuation mark of 7 out of 10. This number implies the stock is priced well compared to both its own basics and its industry group. A closer view of the fundamental analysis report shows several supporting facts:
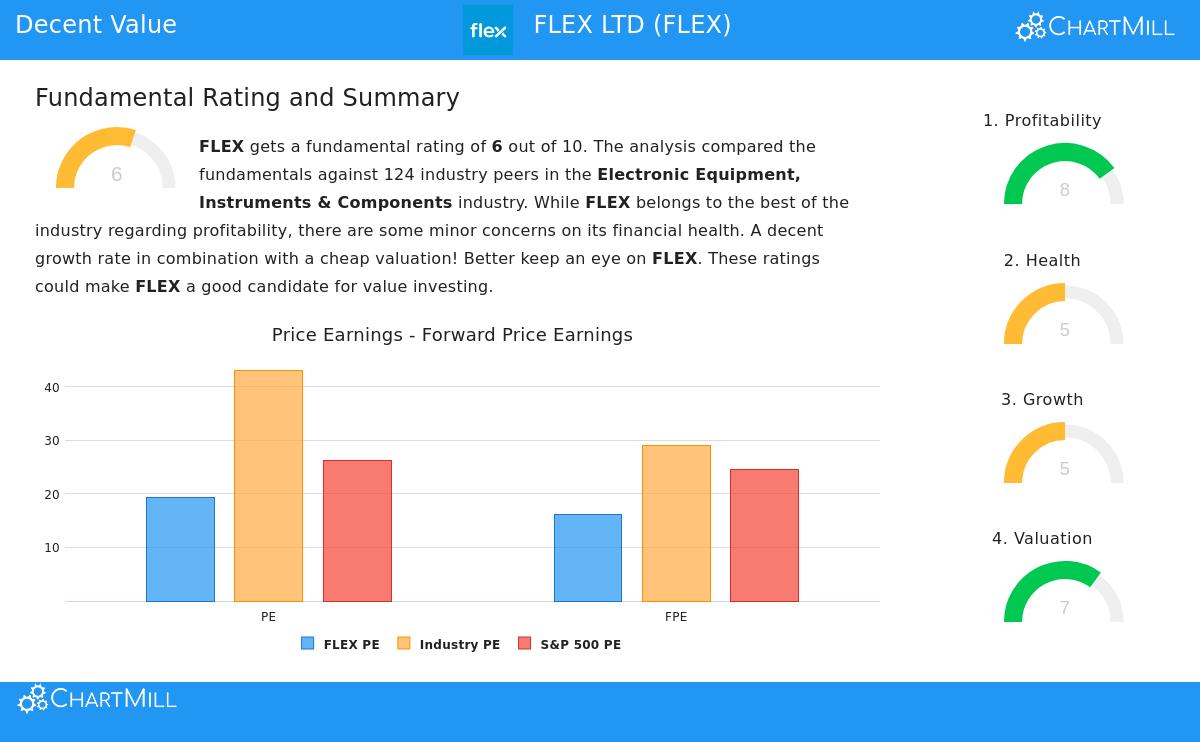
- Price Ratios: While its usual Price/Earnings (P/E) ratio of 19.26 may look high alone, it is actually less expensive than almost 80% of its group in the Electronic Equipment, Instruments & Components field, where the average P/E is above 43. Its expected P/E of 16.14 is also under the industry average.
- Cash Flow & EBITDA: The valuation seems even more interesting on cash-based measures. FLEX is valued as less expensive than 82% of its industry based on its Price/Free Cash Flow ratio. In the same way, its Enterprise Value to EBITDA ratio is less than that of 78% of rivals.
- Growth Adjustment: The stock's low PEG ratio, which changes the P/E for expected profit increase, shows the market may not be completely valuing its future possibility. With profits predicted to rise over 15% each year, the current valuation multiple could be seen as fair, if not inexpensive.
For a value investor, these measures are key. They stand for the number-based beginning point for judging if a stock is trading at a markdown to its real value, giving that needed cushion, or margin of safety, against mistakes in guess or unexpected market drops.
Judging Earnings and Financial Condition
A low-priced stock is only a sound investment if the company is basically healthy. A value trap, a stock that is low-priced for a cause, often comes from weak earnings or a poor balance sheet. FLEX's filter findings help lower this risk, showing a high earnings score of 8 and a satisfactory condition score of 5.
Earnings Strengths: FLEX shows solid returns on capital, a main sign of an effective and well-managed business.
- Its Return on Invested Capital (ROIC) of 13.61% is better than 90% of its industry group.
- Its Return on Equity (ROE) of 17.03% is with the top in its field.
- Both its Profit Margin (3.17%) and Operating Margin (5.28%) have shown good rise in recent years and are higher than most rivals.
Financial Condition Points: The company's financial condition shows a varied but workable view. On the good side, FLEX has a sound Debt/Equity ratio of 0.50 and a good Altman-Z score of 3.00, showing no short-term failure risk. Its debt compared to free cash flow is also positive. However, the report notes some small worries about cash availability, with Current and Quick ratios that are less than many industry peers. For a value investor, this highlights the value of the "condition" filter in the screen, it makes sure the company is not on weak footing, even if there are parts to watch.
Growth Path and Future View
A strict value pick can sometimes miss a growth driver. The screen used here on purpose needs a fair growth mark (5 for FLEX) to find companies with positive motion. FLEX's growth story is split but hopeful.
- Past Results: The company has a strong history of profit growth, with Earnings Per Share (EPS) rising nearly 25% over the past year and at an average yearly rate of 16.4% over several years.
- Future Predictions: Experts expect this strong profit growth to keep going at a rate of over 15% each year. While recent income has been unsteady, predictions point to a return to steady top-line growth of more than 6% per year.
This mix is important. It suggests the company is not just numerically inexpensive but is also actively bettering its profit ability. For the value investor, lasting growth helps shrink the space between the current market price and a higher real value over time.
Closing
FLEX LTD comes from this basic screen as a choice deserving of more careful study for investors with a value view. It seems to meet several key points: valuation multiples that are appealing relative to its industry and growth picture, strong and bettering earnings measures, and a balance sheet that, while showing some cash tightness, is not in trouble. The screen's method, stressing valuation without giving up quality and growth, tries to find companies that may be missed or underrated by the wider market.
It is key to recall that a screen is a beginning point, not a last judgment. Investors should think about the company's cycle link to end markets like automotive and consumer goods, as well as the competitive, low-margin character of its manufacturing services field.
This review was built on a set "Fair Value" screen. You can look at other stocks that now meet similar rules by checking the Fair Value Stocks screen.
Disclaimer: This article is for information and learning only and does not make financial guidance, a suggestion, or a deal or request to buy or sell any securities. The information given is based on data supplied and should not be the only base for any investment choice. Investing includes risk, including the possible loss of original money. Always do your own study and think about talking with a skilled financial guide before making any investment choices.