
For investors who use charts and price action to make decisions, a common method involves finding stocks that are both technically sound and ready for a possible upward move. This method often uses two separate filters: one to measure the basic condition and direction of a stock, and another to find a good entry point. The aim is to locate market leaders that are not only going up, but are also moving in a narrow band, indicating a gathering of force that might come before a notable price jump. This process methodically divides the "what to purchase" from the "when to purchase it," seeking to take part in the most active stages of a stock's rise.
A recent search for such technical breakout formations has pointed to FEDEX CORP (NYSE:FDX) as a notable candidate. The logistics company seems to be showing the exact mix of sound trend condition and a tightening price formation that technical traders frequently look for.
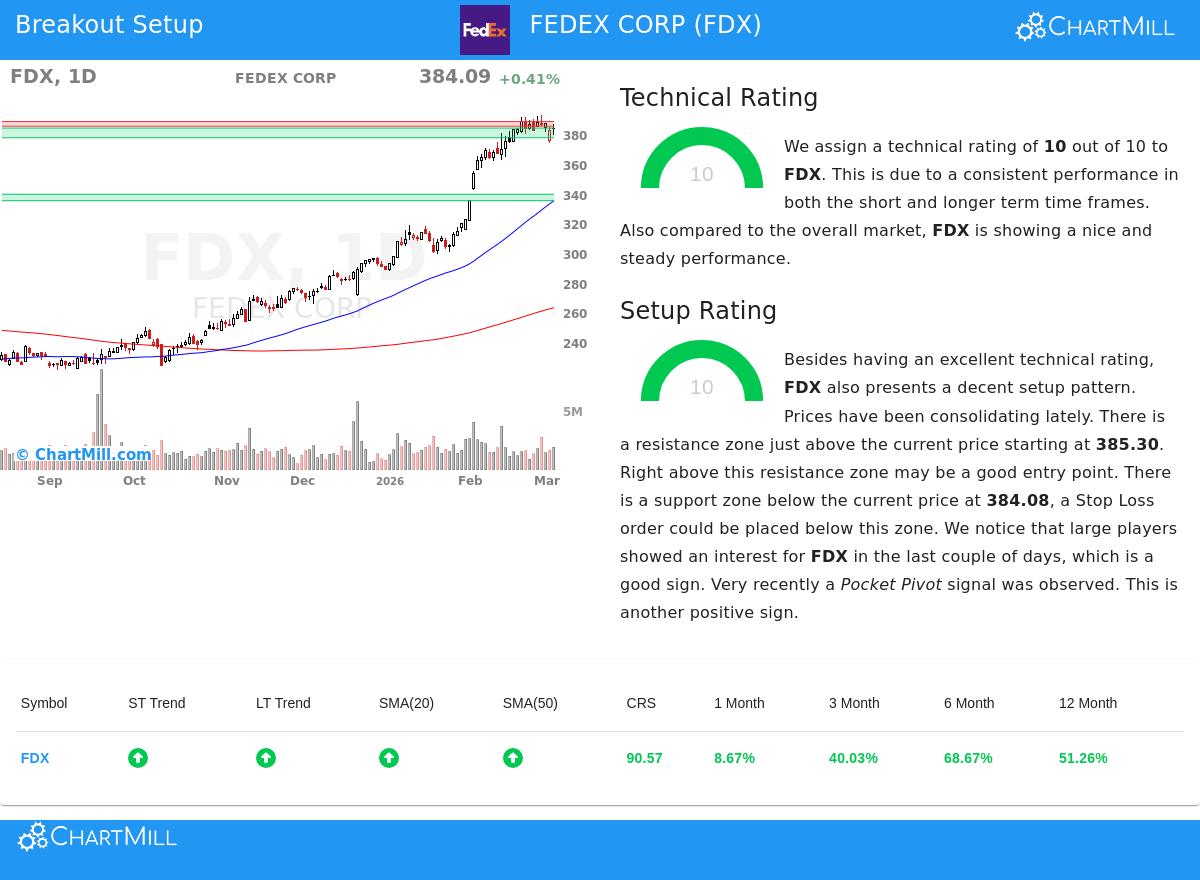
Technical Strength: The Basis of the Trend
The first part of this method is finding stocks with better technical condition, which indicates a steady and dependable upward direction. FedEx does very well here, receiving a highest ChartMill Technical Rating of 10 out of 10. This best score is not awarded easily; it shows very good results across various time periods and measures.
A look into the technical report shows the reasons for this top score:
- Steady Positive Directions: Both the recent and longer-term directions for FDX are rated as positive, a strong sign that movement is consistent across different investment periods.
- Leading Market and Industry Standing: The stock is doing better than 90% of the whole market and 86% of similar companies in the Air Freight & Logistics industry over the last year. This notable comparative performance is a sign of market leadership.
- Solid Movement Measures: FDX is trading close to its 52-week high and is above all its important moving averages (20, 50, 100, and 200-day). The reality that all these averages are increasing confirms the condition and scope of the upward direction.
This sound technical foundation is important because it raises the chance that any following price jump will be lasting and part of the bigger established direction, instead of a short-lived move against the trend.
Setup Quality: Finding the Entry Chance
A strong direction by itself is not a sign to purchase; entering a stock that has just had a big, prolonged move can be dangerous. The second part of the method concentrates on timing, searching for a good-quality setup where the stock is settling its gains. FedEx also stands out here, having a perfect Setup Rating of 10.
The technical report shows that FDX is presenting a standard and hopeful formation:
- Settling Stage: Prices have been trading in a narrow band lately, which is seen as a "bull flag" formation, a short halt or decline after a strong upward move. This settling helps reduce overbought states and can form a foundation for the next step upward.
- Defined Support and Resistance: The setup finds a clear support area below the present price (around $377.55 - $384.08) and a resistance area just above it (around $385.30 - $388.49). These defined levels give logical points for placing stop-loss and buy-stop orders.
- Favorable Market Action: The report mentions positive signs from large participants showing interest in the stock and a recent "Pocket Pivot," a volume-based measure that suggests gathering during the settling stage.
This good-quality setup is necessary because it gives a structured plan for risk control. A trader can specify an exact entry point above resistance, with a stop-loss placed just below the nearby support, making a trade with a measurable and contained risk.
A Specific Trading Situation
From this study, the technical report describes a possible trade setup. It proposes an entry point at $388.50, which is a buy-stop order placed just above the noted resistance area. A price jump above this level could signal the restart of the upward direction. To control risk, a stop-loss order is suggested at $377.54, just below the support area. This plan would limit the possible loss on the trade to about 2.82% from the entry point.
It is important to recall that this is an example created from the technical measures. The space between the entry and exit is seen as being somewhat close compared to the stock's average daily movement, which might result in a greater chance of being stopped out. Traders are advised to evaluate if these levels fit their own risk comfort and time frame.
Locating Additional Breakout Chances
FedEx shows the kind of chance this scanning process is made to find: a market leader in a strong upward direction, pausing before a possible next move. For investors wanting to see a new list of similar technical setups each day, the process that found FDX can be repeated. You can examine the present market for other high-likelihood breakout candidates by going to the Technical Breakout Setups screen.
Disclaimer: This article is for information only and is not investment guidance, a suggestion, or an offer to purchase or sell any security. The study is based on technical measures and past information, which are not assurances of future results. All trading and investment choices involve risk, including the possible loss of initial funds. Readers should do their own investigation and talk with a qualified financial advisor before making any investment choices.