
For investors who use charts and price action to guide their choices, the search for promising opportunities often involves finding stocks that are both technically sound and ready for a near-term move. One organized way to do this is using a "Technical Breakout" screen, which looks for stocks showing two main traits: a high technical health score, pointing to a good underlying uptrend, and a high setup quality score, meaning the stock is trading in a tight range and could be getting ready for its next rise. This process tries to find where momentum and chance meet, looking for entries in strong stocks at times of possible increase.
Our recent use of this process has pointed to First BanCorp (Puerto Rico) (NYSE:FBP) as a candidate that deserves more attention from a technical view. The bank holding company, which offers many consumer and commercial banking services mainly in Puerto Rico and the U.S. Virgin Islands, is now showing a chart pattern that fits the breakout method's main ideas.
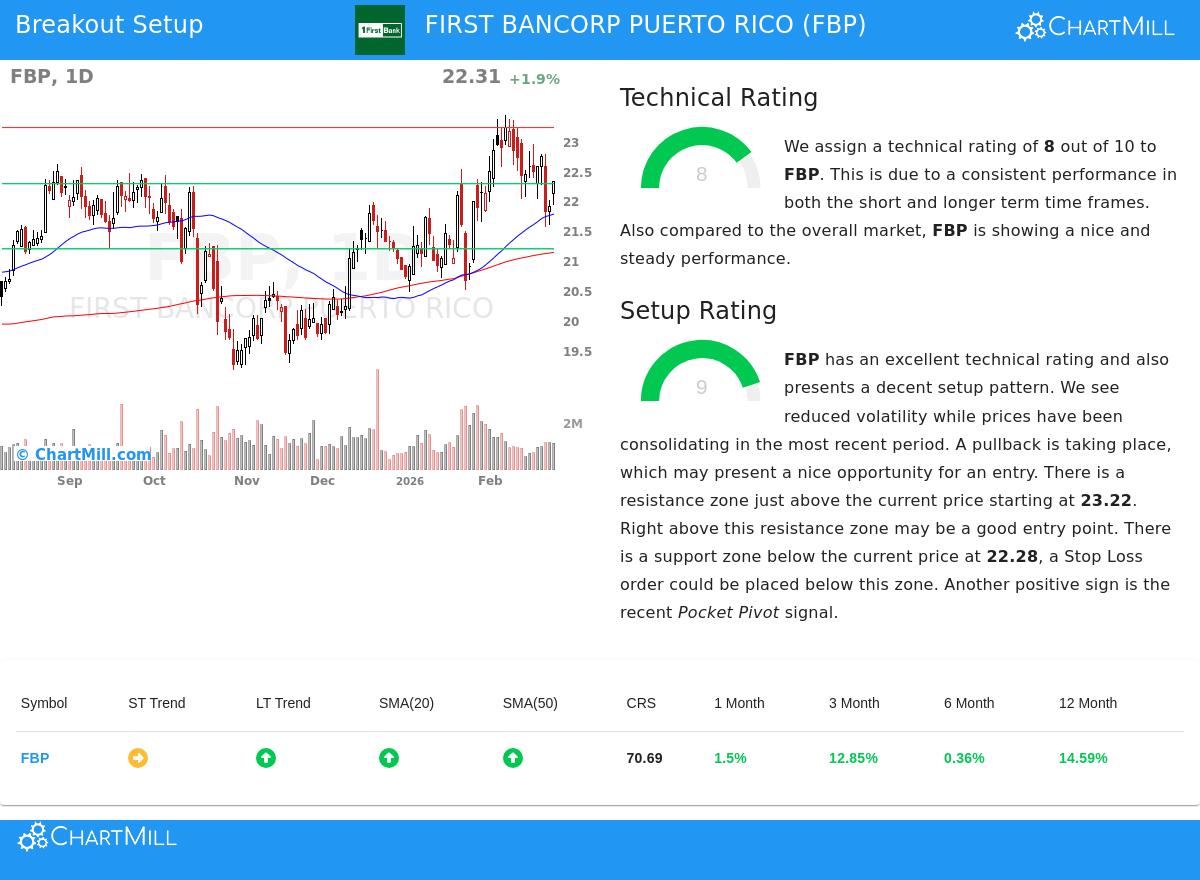
A Base of Technical Soundness
The first part of the breakout screen is a high technical rating, which selects for stocks in clear uptrends, helping to steer clear of declining stocks or poor performers. FBP's technical picture, as shown in its ChartMill Technical Report, has a rating of 8 out of 10, indicating good health. This score comes from several good points:
- Trend Direction: The long-term trend is seen as positive, while the short-term trend is neutral. This pairing can indicate a healthy rest or pause inside a larger upward move, not a turn lower.
- Good Relative Performance: Over the last year, FBP has done better than 70% of all stocks, showing important relative strength. It is also trading in the upper part of its 52-week range.
- Supportive Averages: The stock's price is above its main moving averages (20, 50, 100, and 200-day SMAs), and all these averages are rising. This stacked order of rising averages is a typical sign of continued positive momentum.
This technical base is key because it raises the chance that any move out of a consolidation pattern will keep going in the direction of the main trend, upward.
A Good Setup for a Possible Move
While a strong trend is needed, it is not enough for a good entry. A stock can be in a strong uptrend but be "extended," meaning it has gone up too much too quickly and is at risk of a sharp drop. This is where the setup quality rating becomes important, as it finds stocks that are pausing and gathering energy for their next move.
FBP does well here too, with a setup rating of 9. This high score means the stock is in a clear consolidation phase, which gives a clearer way to handle risk. Main parts adding to this rating are:
- Recent Price Pause: Over the past month, FBP has been trading between $21.56 and $23.43. It is now in the middle of this range, having moved down from recent highs. This coiling action often comes before the price range is resolved.
- Clear Support and Resistance: The study finds a definite support area near $22.28 and a resistance level at $23.22. These set lines create a possible trading range. A clear move above $23.22 could signal a breakout, while staying above $22.28 keeps the positive structure.
- Lower Volatility and Good Signs: The report mentions lower volatility during this consolidation, a common feature before bigger breakouts. Also, a recent "Pocket Pivot" signal was seen, which is a volume-based sign suggesting buying by larger participants.
Bringing the Setup Together for Traders
For a technical trader, these combined signs create a specific view. FBP is a stock with a fundamentally sound trend picture that is now in a constructive pause. The high setup quality suggests this pause is forming a possible starting point. Based on the automated study of the closest support and resistance, a sample trading plan appears:
- A possible entry could be thought about on a move above the $23.22 resistance area, maybe using a buy-stop order near $23.23.
- A sensible stop-loss level could be set just below the noted support at $22.27.
- This plan would set a clear and measured risk of about 4.1% on the trade itself.
It is important to remember this is a sample made from the technical patterns. Individual traders should change such details to match their own risk comfort, time frame, and check the setup with their own study.
Finding Other Chances
The case of First BanCorp shows the kind of chance a disciplined technical breakout screen can find. For investors wanting to see a new list of stocks that fit similar conditions of sound technicals and good-quality setups, new candidates are found each day. You can see the present results by going to the Technical Breakout Setups screen.
Disclaimer: This article is for information and learning only. It is not meant as investment advice, a suggestion, or an offer or request to buy or sell any securities. The study shown is based on technical indicators and automated reports, which are not promises of future results. All trading and investment choices have risk, including the possible loss of the main amount. Readers should do their own research and talk with a qualified financial professional before making any investment choices.