
For technical investors, finding stocks with both good momentum and a clear, low-risk entry point is a central task. One way to handle this is by using a two-part scoring system that looks at a stock's technical condition and the state of its current price pattern. The aim is to locate securities that are in a verified uptrend and also trading in a narrow band, preparing for a possible breakout. This method removes stocks that are merely stretched and centers on those where a planned entry and stop-loss can be easily set.
A recent scan using this method has identified Entergy Corp (NYSE:ETR), a large electric utility company operating in parts of Arkansas, Louisiana, Mississippi, and Texas. The company's stock now shows a notable technical picture that deserves more attention from investors who watch chart patterns.
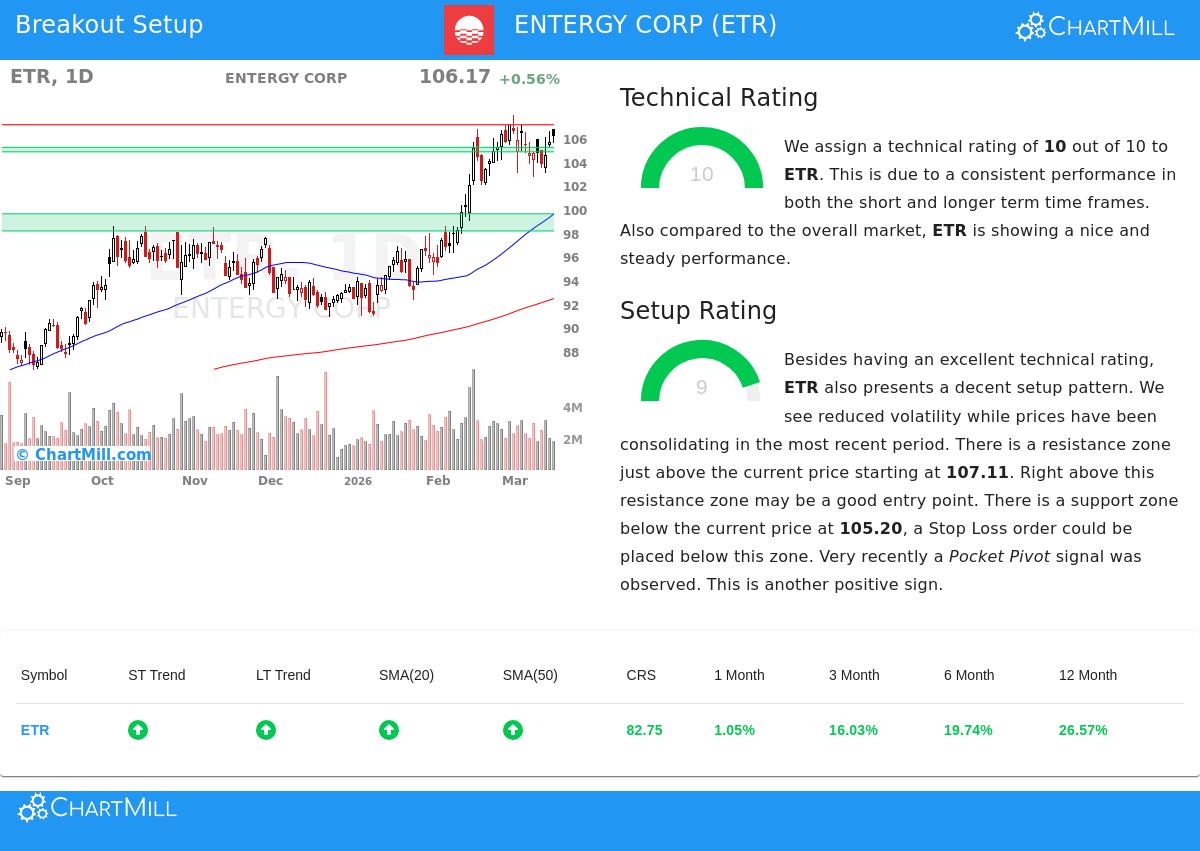
A Base of Very Good Technical Condition
The first part of this method is finding stocks with good and lasting uptrends. Entergy Corp does very well here, receiving a top Technical Rating of 10 out of 10. This high score shows condition across different time periods and measures, which is important for the method as it looks for market leaders, not short-term recoveries.
A close look at the technical report shows several main points of condition:
- Trend Agreement: Both the long-term and short-term trends for ETR are rated as positive. This agreement across time periods indicates a unified upward move, not a brief rally within a larger decline.
- Good Relative Performance: The stock has done better than 82% of all other stocks over the last year and is trading close to its 52-week high. It is important to see that it is ahead of the wider market, as the S&P 500 itself is not trading near new highs. This shows separate strength.
- Position in Its Sector: Within the Electric Utilities industry, ETR performs better than 77% of its 46 competitors, confirming it as a sector leader.
- Backing from Moving Averages: The stock price is above all its main simple moving averages (20, 50, 100, and 200-day), and each of these averages is also rising. This forms a tiered base of support under the price.
This combination gives the "which stock" answer for technical investors: ETR is a chart with fundamentally good condition showing leader traits. You can see the complete technical analysis on ChartMill here.
A Good Formation for a Possible Breakout
A strong trend by itself is not a buy signal; entering at a bad time in a stretched stock can cause quick losses. The second part of the method is the Setup Quality Rating, which measures if the stock is making a constructive consolidation pattern. ETR gets a 9 out of 10 here, meaning a very good formation.
The current price activity shows ETR has been trading in a narrow band between about $102 and $108 over the last month, a typical sign of consolidation after a previous rise. This lower volatility, often viewed as a "bull flag" pattern (which the report mentions is there), allows for a precise setting of risk.
- Set Resistance and Support: The consolidation has made a clear resistance area just above the current price, near $107.11. A clear move above this point could indicate the next phase of the uptrend.
- Clear Stop-Loss Point: Just below the current price, a support area exists near $105.20. This gives a sensible and close point to set a protective stop-loss order, reducing downside risk if the breakout does not happen.
- Supporting Volume Activity: The report also mentions a recent "Pocket Pivot" signal, a pattern where the stock rises on volume greater than the highest down-volume day in the recent period. This can be an early indicator of institutional buying during the consolidation.
This high setup score answers the "when" question. It indicates ETR is not stretched but is instead moving within a set band, offering a possible entry point with a controlled risk level.
A Specific Trade Idea
From this analysis, the technical report describes a sample trade idea. The proposed entry is a buy-stop order at $107.12, just above the noted resistance, waiting for the breakout to be confirmed. The proposed stop-loss is set at $104.81, below the nearby support area. This creates a risk of about 2.16% on the trade itself. For a portfolio view, the report proposes using 25% of capital for this idea, which would mean a total portfolio risk of about 0.54% if the stop is reached.
It is very important to note that this is an automated example for learning. Investors must always do their own analysis, think about coming company events like earnings, and change entry/exit points and position size to match their own risk comfort and trading plan.
Locating Other Ideas
The process that found Entergy Corp can be used each day to find other possible breakout formations. Investors wanting to see a fresh list of stocks that fit similar conditions of high technical and setup ratings can run the scan themselves using this Technical Breakout Setups link.
Disclaimer: This article is for information and learning only. It is not investment advice, a suggestion, or an offer to buy or sell any security. The trade idea discussed is made automatically and is an example. You should do your own research and talk with a qualified financial advisor before making any investment choices. Investing has risk, including the possible loss of your initial investment.