
For investors who use charts and price action to make decisions, a common method involves finding stocks that are both technically sound and ready for a possible rise. This method often centers on two main parts: the basic condition of the stock's trend and the nature of its current pause pattern. A stock in a solid uptrend that is taking a short rest, forming a narrow trading area, can point to a chance for that trend to resume. The Technical Breakout Setups screen is made to sort the market for exactly these situations, using specific measures to judge a stock's technical condition and setup nature.
Enbridge Inc (NYSE:ENB), a large North American energy infrastructure company, recently appeared in this screen, presenting an interesting case for technical investors. The company's main business of operating pipelines and utilities provides a setting of relative steadiness, but it is the recent price action that draws the notice of chart-focused traders.
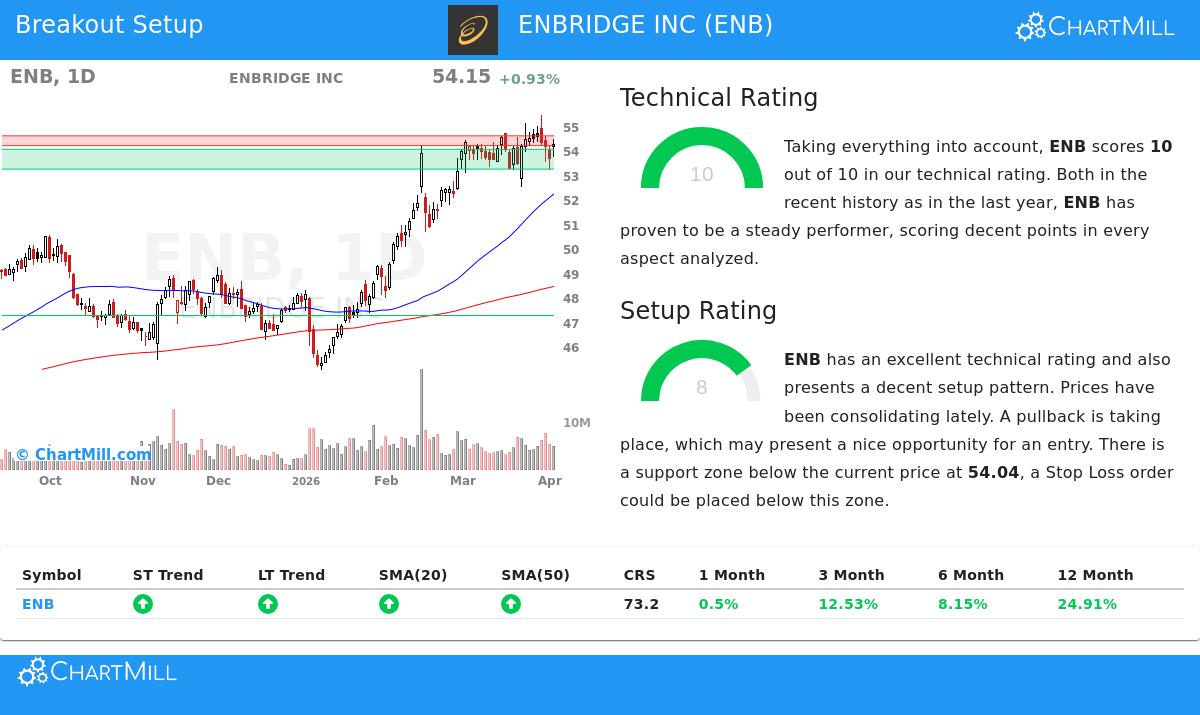
Looking at the Technical Condition
The base of any breakout trade is the basic trend. A stock trying to break out from a poor or falling base is much less dependable than one coming from a solid, steady uptrend. The ChartMill Technical Rating for ENB is a full 10 out of 10, putting it with the market's best from a technical view. This high rating is not given easily and is formed on several points of condition clear in the detailed technical report.
- Positive Trend Agreement: Both the short-term and long-term trends for ENB are rated as positive. This agreement across time periods is a strong sign, showing steady buying pressure and an absence of notable internal selling.
- Sound Relative Performance: Over the last year, ENB has done better than 73% of all stocks in the market. Significantly, this performance has been steady, implying the gains are part of a constant trend and not a short jump.
- Place vs. the Market: ENB is now trading near its 52-week high. In comparison, the wider S&P 500 index is not, meaning ENB is showing leadership and separate condition, a main feature for good breakout choices.
- Moving Average Backing: The stock price is trading above all its main simple moving averages (20, 50, 100, and 200-day), and each of these averages is itself in a rising pattern. This makes a layered support structure below the price.
Judging the Setup Nature
A solid trend is needed, but it is not enough for a good trade entry. Buying a stock that has already made a big, stretched move often leads to buying at a top. The best entry point comes after a time of pause within the uptrend, where the stock absorbs its gains and builds energy for its next step up. This is where the Setup Nature rating becomes important.
ENB gets a Setup Rating of 8, pointing to a high-grade pause pattern. The study indicates a stock that has been trading in a narrow area lately, which is just the sort of action technical investors seek before a possible breakout.
- Recent Pause: In the last month, ENB has been held within a small area between $52.50 and $55.44. This coiling action lowers volatility and can often come before a clear move.
- Clear Support and Resistance: The technical study finds a well-marked support area between $53.23 and $54.04, made by a mix of moving averages and trendlines. Just above the current price sits a resistance area between $54.19 and $54.59. These clear levels give objective points for planning a trade.
- Practical Trade Levels: Based on this structure, the study proposes a possible trading setup. An entry order could be set just above the resistance area at $54.60, expecting a confirmed breakout. A protective stop-loss order could then be set just below the support area at $53.22, outlining and limiting the trade's risk.
Summary and Following Actions
The mix of a full Technical Rating (10) and a high Setup Rating (8) makes ENB a notable choice from a technical breakout screening view. It shows the method's aim: to find market-leading stocks that are taking a sound pause, giving a measured chance to join the next part of their climb. Of course, a high rating does not promise a good breakout, and investors must always do their own study, think about wider market states, and use careful risk management with stop-loss orders.
The Technical Breakout Setups screen is run each day to find new chances as market states change. You can see the present list of fitting stocks and run the screen yourself by using this link: Technical Breakout Setups Screen.
,
Disclaimer: This article is for information only and does not make up investment advice, a suggestion, or an offer or request to buy or sell any securities. The study shown is based on technical measures and should not be the only base for any investment choice. All investing has risk, including the possible loss of principal. Always do your own research and think about talking with a qualified financial advisor before making any investment choices.