
CONSOLIDATED EDISON INC (NYSE:ED) was identified as a Technical Breakout Setup Pattern by our stockscreener. Such a pattern occurs when we see a pause in a strong uptrend: after a strong rise the stock is consolidating a bit and at some point the trend may be continued. Whether this actually happens can not be predicted of course, but it may be a good idea to keep and eye on NYSE:ED.
What is the technical picture of ED telling us.
ChartMill assigns a Technical Rating to every stock. This score ranges from 0 to 10 and is updated daily. The score is determined by evaluating multiple technical indicators and properties.
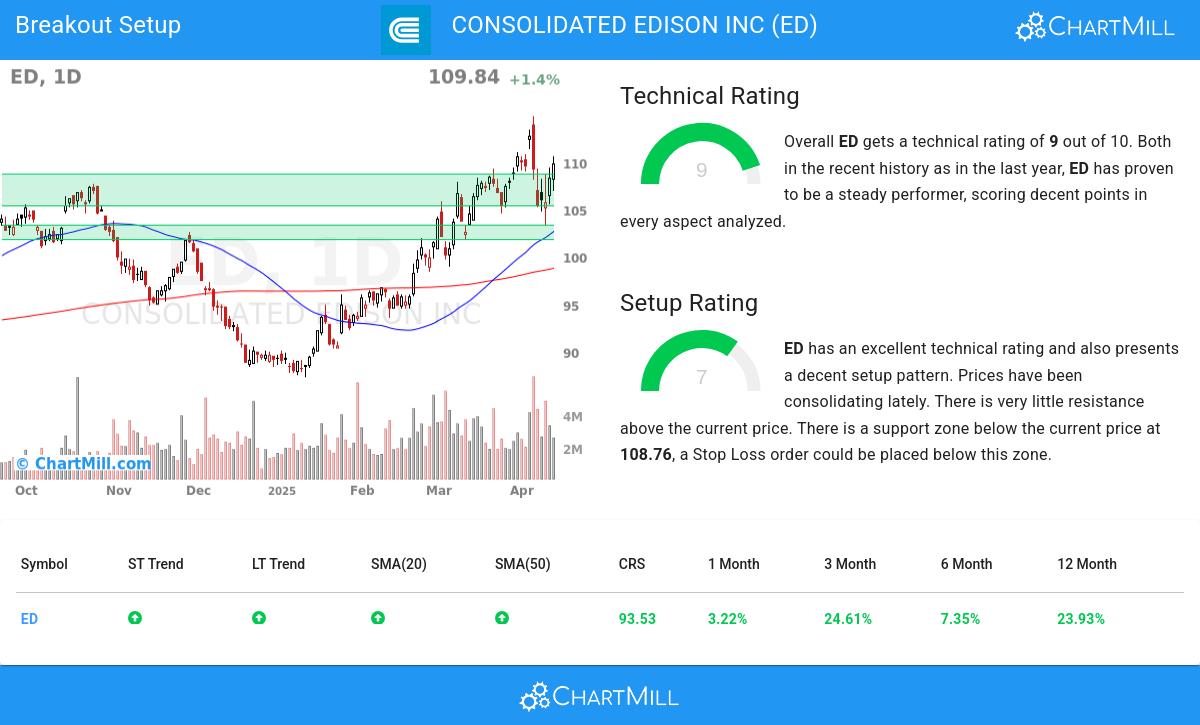
Taking everything into account, ED scores 9 out of 10 in our technical rating. This is due to a consistent performance in both the short and longer term time frames. Also compared to the overall market, ED is showing a nice and steady performance.
- The long and short term trends are both positive. This is looking good!
- ED is part of the Multi-Utilities industry. There are 25 other stocks in this industry. ED outperforms 87% of them.
- ED is currently trading in the upper part of its 52 week range. The market is still in the middle of its 52 week range, so ED slightly outperforms the market at the moment.
- In the last month ED has a been trading in the 103.28 - 114.87 range, which is quite wide. It is currently trading in the middle of this range where prices have been consolidating recently, this may present a good entry opportunity, but some resistance may be present above.
- When comparing the yearly performance of all stocks, we notice that ED is one of the better performing stocks in the market, outperforming 93% of all stocks. However, this relatively good performance is mostly due to a recent big move.
Our latest full technical report of ED contains the most current technical analsysis.
How do we evaluate the setup for ED?
Besides the Technical Rating, ChartMill assigns a Setup Rating to every stock to determine the degree of consolidation. This rating, ranging from 0 to 10, is updated daily and evaluates various short-term technical indicators. ED currently holds a 7 as its setup rating, suggesting a particular level of consolidation in the stock.
ED has an excellent technical rating and also presents a decent setup pattern. Prices have been consolidating lately. There is very little resistance above the current price. There is a support zone below the current price at 108.76, a Stop Loss order could be placed below this zone.
How to trade ED?
To potentially initiate a trade, it is common practice to wait for the stock to break out of the consolidation zone. This breakout signifies a potential upward movement, and traders may enter the stock at that point. Conversely, if the stock falls back below the consolidation zone, it may be sold at a loss.
This article should in no way be interpreted as trading advice. You should always make your own analysis and trade or not trade based on your own observations and style. The article is based purely on some technical observations.
More breakout setups can be found in our Breakout screener.
Disclaimer
Important Note: The content of this article is not intended as trading advice. It is essential to perform your own analysis and exercise caution when making trading decisions. The article presents observations created by automated analysis but does not guarantee any trading or investment outcomes. Always trade responsibly and make independent judgments.