
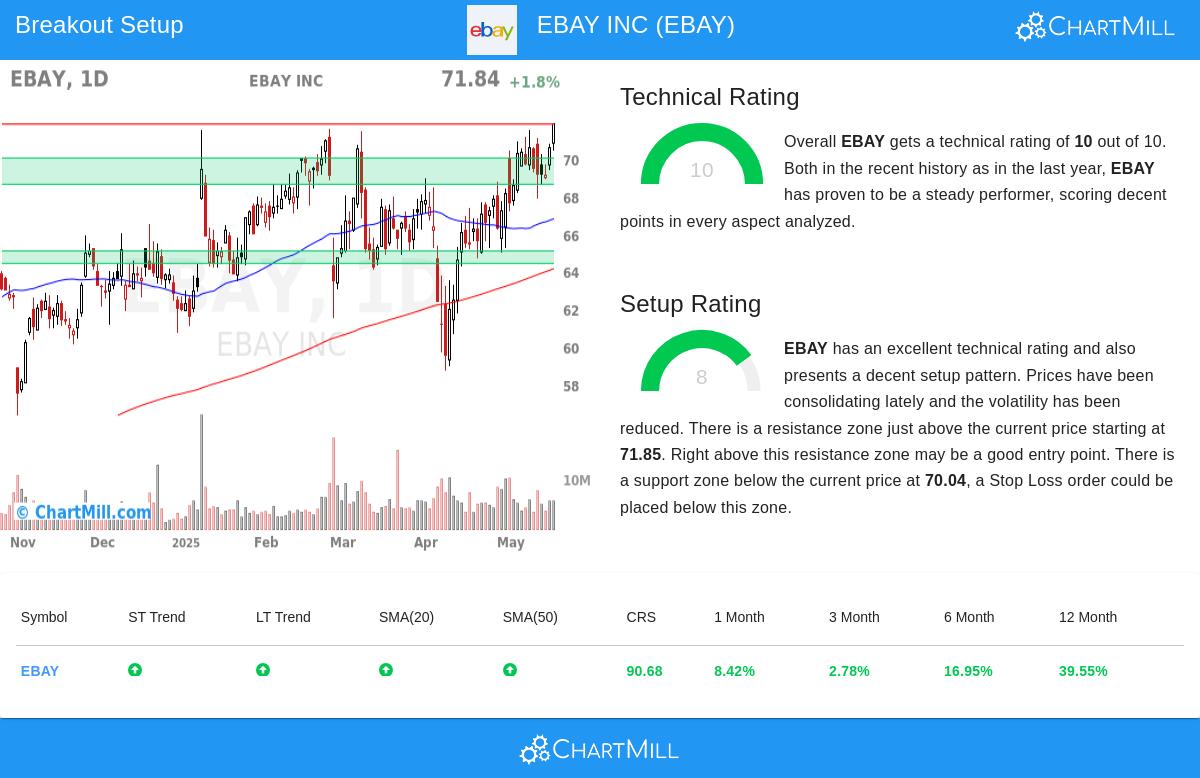
EBAY INC (NASDAQ:EBAY) has been identified as a strong technical candidate by our breakout screener. The stock currently holds a perfect Technical Rating of 10 and a solid Setup Rating of 8, signaling both a healthy trend and a favorable consolidation pattern. Below, we examine why this stock stands out for technical investors.
Technical Strength
EBAY’s Technical Rating of 10 reflects its strong momentum across multiple timeframes. Key observations from the technical report include:
- Trend Strength: Both short-term and long-term trends are positive, with the stock trading near a 52-week high.
- Relative Performance: EBAY has outperformed 90% of all stocks over the past year and ranks in the top 14% of its Broadline Retail industry.
- Moving Averages: The stock is trading above all key moving averages (20-day, 50-day, 100-day, and 200-day), confirming sustained upward momentum.
- Volume Support: Average daily volume remains healthy at 5.9 million shares, ensuring liquidity.
Setup Quality
With a Setup Rating of 8, EBAY shows a well-defined consolidation pattern, offering a potential breakout opportunity:
- Consolidation Zone: The stock has been trading between $64.68 and $71.90 over the past month, with volatility decreasing recently.
- Resistance Breakout Point: A clear resistance level sits at $71.85. A move above this level could trigger further upside.
- Support Levels: Multiple support zones exist below, including a key area between $68.64 and $70.04, providing a logical stop-loss level.
- Risk/Risk Profile: The suggested entry at $71.86 with a stop at $68.63 presents a controlled risk of about 4.5%.
Conclusion
EBAY’s combination of strong technicals and a well-formed setup makes it a stock worth monitoring for breakout traders. The stock’s leadership in its sector and consistent upward trend add to its appeal.
For more breakout candidates, check our Technical Breakout Setups screener, updated daily.
Disclaimer
This is not investment advice. Always conduct your own analysis before making trading decisions.