
For investors who use charts and price action to make choices, a methodical way to find possible trades is important. One such technique looks for stocks that are both technically sound and making a constructive price pattern, a pairing that can point to a coming breakout. This method centers on two proprietary scores from ChartMill: the Technical Rating, which judges the general condition and direction of a stock, and the Setup Quality Rating, which examines if the stock's present price action shows a clear and lower-risk entry point. By sorting for stocks with good scores in both areas, traders try to find chances in market leaders that are resting before their next possible rise.
A recent search using this method has pointed out DAVITA INC (NYSE:DVA) as a candidate deserving more attention from a technical view. The kidney care services provider seems to be meeting the needed conditions for a possible upward move.
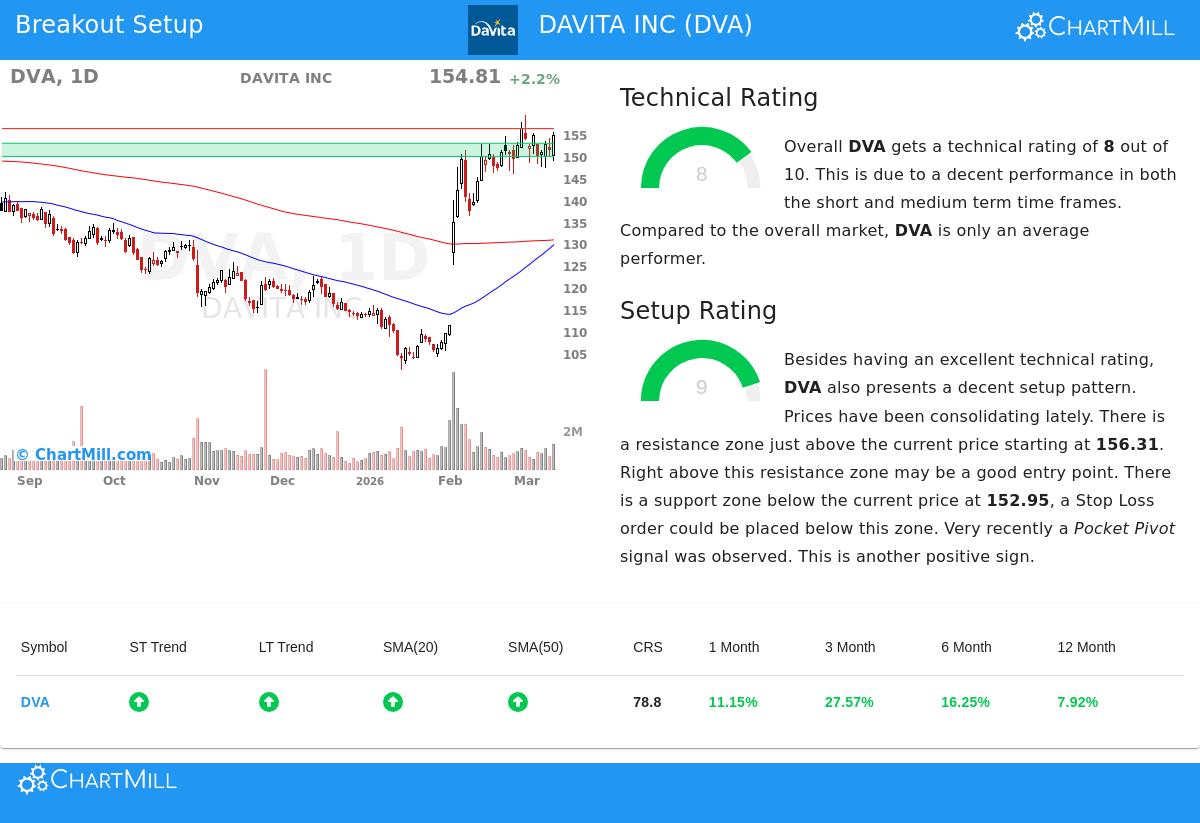
Judging the Technical Base
The first part of this breakout method is a sound technical background. A good Technical Rating shows a stock is in a confirmed upward trend and doing better than similar stocks, which is needed for a breakout to keep going. DAVITA INC's technical picture, as shown in its full technical report, displays notable soundness.
- Trend Agreement: Both the long-term and short-term trends for DVA are seen as positive. This agreement across time periods points to a united upward push rather than a brief jump.
- Moving Average Backing: The stock is priced above all its main simple moving averages (20, 50, 100, and 200-day), and each of these averages is itself moving upward. This layered arrangement of support levels is a typical mark of a sound upward trend.
- Relative Performance: DVA is doing better than 78% of all stocks in the market over the last year and sits in the top group of its Health Care Providers & Services industry, outperforming 72% of similar companies. This relative performance is a main separator, showing funds are moving into the stock even as the wider S&P 500 shows a negative long-term direction.
This mix of factors gives DVA a Technical Rating of 8 out of 10. For the breakout method, this confirms the stock is in the right "area"—it is a market leader with established upward push, giving a good setting for any new price jump.
Examining the Setup Quality
A solid trend by itself is not a buy signal; entering a stock that has already made a big, stretched move can be risky. This is where the Setup Quality Rating becomes important. It finds times of consolidation or tight trading ranges inside the wider upward trend, offering a possible lower-risk entry point. DVA does very well here with a near-ideal Setup Rating of 9.
- Consolidation Pattern: The analysis notes that prices have been consolidating recently and finds a specific bull flag pattern. This pattern usually forms after a strong rise and shows a pause, letting the stock rest before a possible continued climb.
- Clear Support and Resistance: The report finds a well-marked support area between $149.93 and $152.95, made by a coming together of moving averages and trendlines. Just above the present price, a resistance level is at $156.31. These clear levels allow for exact trade planning.
- Supportive Volume Activity: A recent "Pocket Pivot" signal was seen, which is a volume-based sign pointing to accumulation by bigger investors during the consolidation phase. This can be a forerunner to a breakout.
For a technical trader, this setup is appealing because it states the trade details clearly. The consolidation gives a possible entry, the resistance level gives a breakout trigger point, and the support area offers a sensible place to set a stop-loss order to control risk.
A Possible Technical Situation
Based on this study, a technical play could involve waiting for DVA to clearly move above the $156.31 resistance level on higher-than-normal volume, which could signal the finish of the consolidation and the start of a new upward phase. The nearby support area around $152 would then act as a natural zone to place a protective stop, limiting the downside risk on the trade. The automatically created setup suggests an entry at $156.32 with an exit stop at $149.92, showing a measured risk of about 4.1%.
Find More Possible Breakout Setups
The search that found DAVITA INC is run each day to find new chances. Investors looking for other stocks showing similar mixes of technical soundness and good-quality setup patterns can view the present results through the Technical Breakout Setups screen.
Disclaimer: This article is for information only and is based on a technical analysis method. It does not make up investment advice, a suggestion to buy or sell any security, or a support of any trading plan. The noted trade setup is an automatically created example for illustration. Investors should do their own study, think about their personal risk comfort, and talk with a qualified financial advisor before making any investment choices. Past results are not a guide to future results.