
For investors aiming to assemble a portfolio of lasting, high-standard businesses, the quality investing philosophy offers a persuasive framework. This method centers on finding companies with durable competitive strengths, reliable earnings, and sound finances, with the goal of owning them for an extended period. One useful technique for finding these companies is the "Caviar Cruise" stock screen, which selects for measurable signs of quality, like high returns on capital, good cash flow production, and a record of earnings growth. A recent run of this screen pointed to Darden Restaurants Inc (NYSE:DRI), the owner of well-known brands such as Olive Garden and LongHorn Steakhouse, as a possible prospect for more detailed review.
Satisfying the Main Standards for Quality
The Caviar Cruise screen uses a number of strict filters to separate companies with solid fundamental traits. Darden Restaurants seems to satisfy these important standards, which are vital to the quality investing idea of looking for effective, profitable, and financially stable businesses.
-
High Return on Invested Capital (ROIC): A key part of quality investing, a high ROIC shows how well a company produces profits from the capital it has invested. The screen calls for an ROIC (leaving out cash, goodwill, and intangibles) over 15%. Darden's stated ROICexgc of 17.20% not only meets this requirement but also exceeds the results of about 75% of its industry competitors, implying it uses capital with better-than-average effectiveness.
-
Firm and Rising Profit Growth: The strategy looks for companies where core operating profits are increasing solidly. The filter requires a 5-year CAGR for EBIT (earnings before interest and taxes) above 5%, and importantly, that this EBIT growth is faster than revenue growth, a signal of widening profit margins and possible pricing strength. Darden's numbers are persuasive here:
- 5-Year EBIT CAGR: 26.36%
- 5-Year Revenue CAGR: 5.77% This large difference shows that Darden has effectively turned modest sales rises into much higher operating profits, a sign of a capably run business with scale benefits.
-
Sound Financial Condition and Cash Flow: Quality investors favor companies that can support themselves. The screen assesses this in two ways:
- Debt Level: The Debt-to-Free Cash Flow ratio indicates how many years of present cash flow would be required to repay all debt. A ratio under 5 is viewed as acceptable. Darden's ratio of 4.42 fits within this range, suggesting its debt level seems workable compared to the cash it produces.
- High-Grade Earnings: The "Profit Quality" figure calculates the percentage of net income turned into free cash flow over five years. A number above 75% is sought, showing earnings are supported by actual cash. Darden's average of 105.36% is outstanding, meaning it creates more free cash flow than its accounting net income. This offers notable financial room for dividends, share repurchases, or new investment.
A Summary of Darden's Fundamental Picture
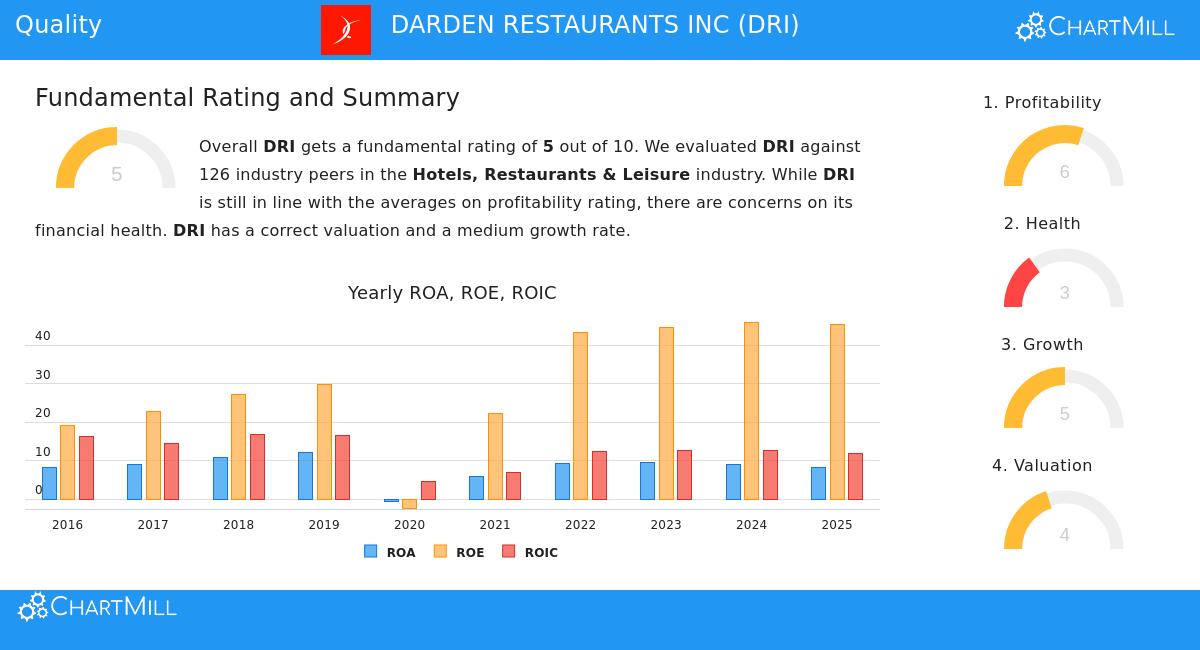
Apart from the specific screen filters, a wider view of Darden's fundamental analysis report shows a varied but mostly firm image. The company gets an overall fundamental score of 5 out of 10, meaning it matches market averages in some aspects but has clear strong points and soft points.
- Profitability is a Definite Strong Point: Darden scores favorably on profitability measures (a score of 6). It has a high Return on Equity of over 53%, doing better than 92% of its industry. Its operating margin has shown good increase in recent years. However, its gross margin is below many competitors, a usual trait in the contested restaurant field.
- Financial Condition Presents Some Considerations: The company's health score is a lower 3, mainly because of liquidity points. Its current and quick ratios are under 1, which is normal for the restaurant industry due to inventory and pre-paid costs but still shows dependence on operational cash flow to cover near-term bills. Regarding solvency, its debt-to-equity ratio is high, though its debt-to-FCF ratio stays workable as mentioned before.
- Growth and Valuation are Moderate: Darden has a good history of EPS and revenue growth, with past EPS growth averaging close to 25% per year. Future growth projections are more measured but still positive. Valuation measures show a neutral picture; while its P/E ratio looks high on its own, it is actually less expensive than many industry peers and about even with the wider S&P 500.
For a complete summary of these measures, you can examine the full fundamental analysis report for DRI.
Final Thoughts: A Prospect for the Quality-Oriented Watchlist
Darden Restaurants makes a firm argument for evaluation under a quality investing structure. It meets the numerical requirements of the Caviar Cruise screen by showing high returns on capital, a strong pattern of profit margin improvement, and solid free cash flow production. These characteristics fit with the quality investor's hunt for companies with lasting competitive strengths and effective management. While the fundamental analysis notes areas for attention, specifically regarding liquidity and debt, the central operational performance and cash conversion effectiveness are convincing.
It is vital to recall that numerical screens are initial steps for more thorough investigation. The Caviar Cruise method itself states that elements like a lasting competitive advantage, able leadership, and pricing strength are necessary qualitative verifications. For investors interested in this quality-centered method, the screen that found Darden can be employed to examine other possible prospects. You can find more outcomes and modify the standards using the Caviar Cruise stock screener.
Disclaimer: This article is for informational purposes only and does not constitute financial advice, an endorsement, or a recommendation to buy, sell, or hold any security. Investing involves risk, including the potential loss of principal. You should conduct your own research and consult with a qualified financial advisor before making any investment decisions.