
For investors who use charts and price action to guide their choices, the search for good opportunities often comes down to two basic questions: which stock is in a solid trend, and when is the correct time to enter that trend? A methodical way to answer these questions involves looking for stocks that mix sound technical condition with a high-grade consolidation pattern, indicating a possible breakout. This process selects for equities that are not only market leaders but are also moving in a tight band, giving a clear and specific risk point for a new trade.
Dana Inc (NYSE:DAN), a top provider of drive and motion technology for vehicles, has recently appeared on such a search. The company's technical picture indicates it may be preparing for its next important move.
Looking at the Technical Base
The first part of this plan is finding stocks with solid basic technical momentum. A high technical score shows a stock is in a steady uptrend, doing better than similar stocks, and showing good agreement across important moving averages. This basic soundness is key because it raises the chance that a breakout from consolidation will keep going in the direction of the main trend.
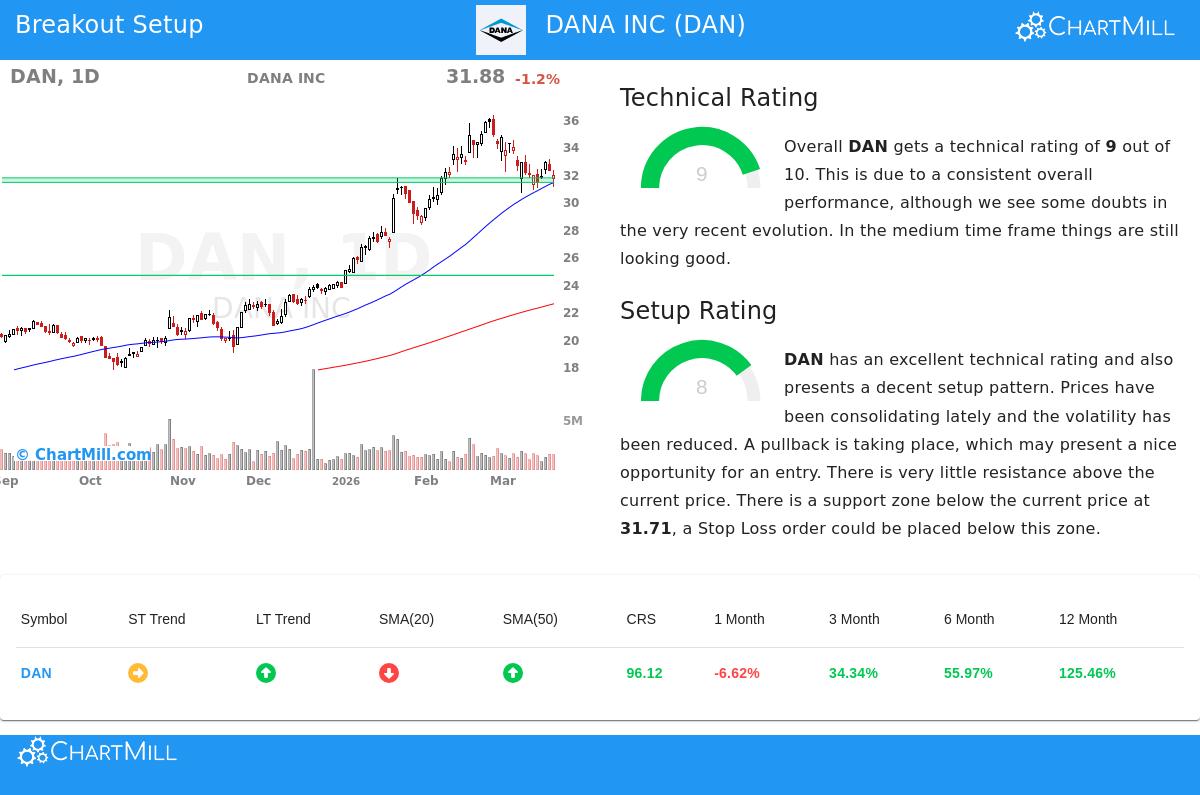
Based on its detailed technical report, Dana gets a strong technical score of 9 out of 10. This number is backed by several convincing data points:
- Long-Term Trend Soundness: The long-term trend for DAN is marked as positive. This is shown by the stock trading well above its rising 50-day, 100-day, and 200-day simple moving averages.
- Notable Relative Performance: Over the last year, DAN has done better than 96% of all stocks in the market. Inside its specific Automobile Components industry, it is in the top 3%, doing better than 97% of its 41 peers.
- Market Agreement: The stock is trading in the higher part of its 52-week range, which is now from $10.11 to $36.28. This matches the wider S&P 500, which is also in the higher part of its yearly range, indicating DAN's condition is not happening alone.
While the short-term trend is now neutral and the stock has moved down from its recent highs, the overall technical view stays clearly sound. This firm base is just what technical investors seek before thinking about an entry.
Judging the Setup Grade
A solid trend by itself is not a buy signal. Entering a stock that has just made a big, stretched move often results in buying at a high point. The second key question, when to buy, is answered by judging the setup grade. A high setup score points to a time of consolidation, where volatility lessens and the stock trades in a small band. This makes a specific support level for putting protective stop-loss orders and a clear resistance level that, if broken, can signal the start of the next step up.
Dana's setup grade is scored at 8 out of 10, pointing to a good consolidation pattern. The technical report notes several key features:
- Price Consolidation: The stock has been trading in a band between $30.59 and $36.28 over the last month and is now near the lower part of this band. This move down within the frame of a solid long-term uptrend may be making a possible entry area.
- Specific Support: The analysis finds an important support area between $31.38 and $31.71. This area is strengthened by a mix of trendlines and key moving averages across many timeframes. For a trader, this gives a solid area below which a stop-loss order could be placed to handle risk.
- Little Overhead Resistance: The report states there is very small resistance above the present price, meaning a breakout could meet little hindrance on its way up.
The mix of a top technical score (9) and a high-grade setup (8) puts Dana in a small group of stocks that are both trending solidly and set for a possible continuation move. The automatic analysis indicates a possible trading plan with an entry just above a recent level at $33.41 and an exit stop below the support area at $31.37.
Locating More Possibilities
Dana Inc shows the kind of possibility that methodical technical searches are made to find. For investors wanting to see the current list of stocks showing similar high-scored technical and setup patterns, the Technical Breakout Setups screen is refreshed daily with new possible choices.
Disclaimer: This article is for information only and does not make up investment advice, a suggestion, or an offer to buy or sell any security. The analysis is from automatic technical data and should not be the only base for an investment choice. Always do your own study, think about your money situation and risk comfort, and talk with a qualified money advisor before making any investment. Trading stocks includes risk, including the possible loss of principal.