
We've identified COSTAR GROUP INC (NASDAQ:CSGP) as a potential breakout candidate based on our stock screener's analysis. This breakout setup pattern suggests that after a strong uptrend, the stock is currently consolidating, potentially signaling a continuation of the trend. Keep an eye on NASDAQ:CSGP for further developments.
Insights from Technical Analysis
Every day, ChartMill assigns a Technical Rating to each stock, providing a score ranging from 0 to 10. This rating is determined by evaluating various technical indicators and properties.
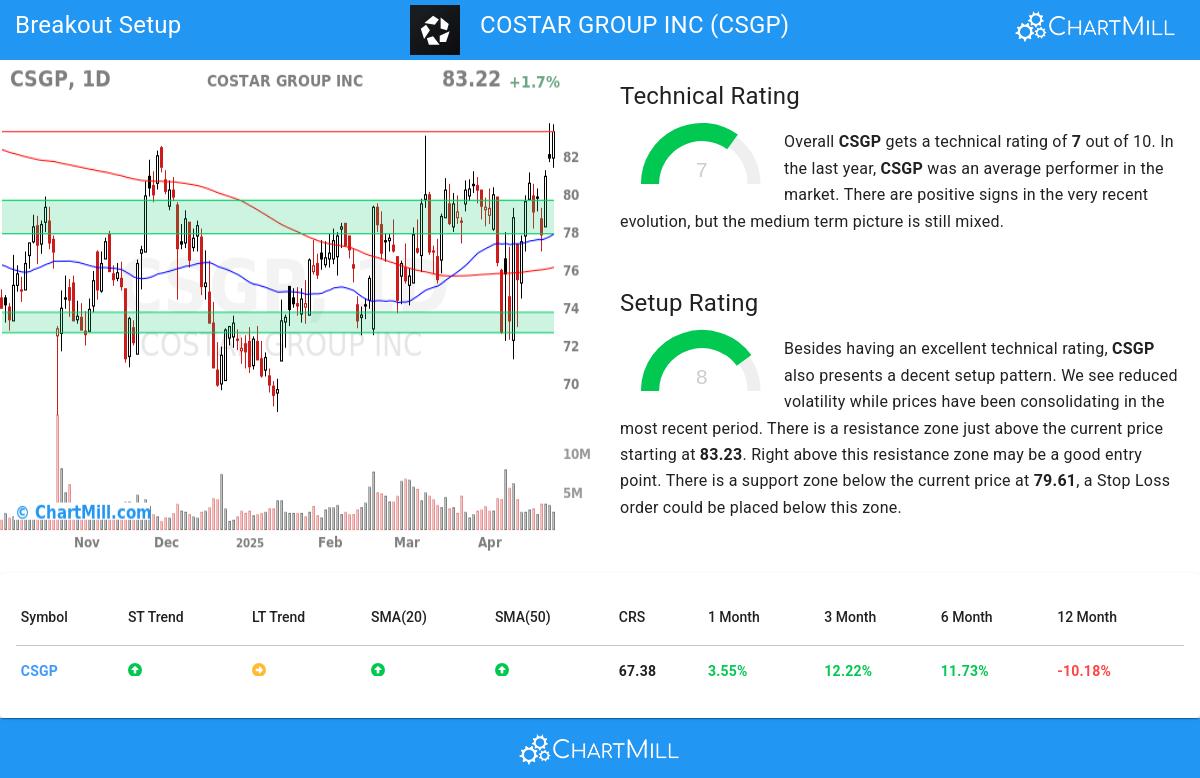
Overall CSGP gets a technical rating of 7 out of 10. CSGP has been a medium performer in the overall market. Some doubts are observed in the medium time frame, but recent action was very positive.
- The long term trend is still neutral, but the short term trend is positive, so the stock is getting more and more appreciated by traders and investors.
- In the last month CSGP has a been trading in the 71.21 - 83.68 range, which is quite wide. It is currently trading near the high of this range.
- When compared to the yearly performance of all other stocks, CSGP outperforms 67% of them, which is more or less in line with the market.
- CSGP is part of the Real Estate Management & Development industry. There are 64 other stocks in this industry, CSGP did better than 68% of them.
- CSGP is currently trading in the middle of its 52 week range. This is in line with the S&P500 Index, which is also trading in the middle of its range.
Check the latest full technical report of CSGP for a complete technical analysis.
How does the Setup look for CSGP
ChartMill also assign a Setup Rating to every stock. With this score it is determined to what extend the stock has been trading in a range in the recent days and weeks. This score also ranges from 0 to 10 and is updated daily. The setup score evaluates various short term technical indicators. CSGP scores a 8 out of 10:
CSGP has an excellent technical rating and also presents a decent setup pattern. Prices have been consolidating lately and the volatility has been reduced. There is a resistance zone just above the current price starting at 83.23. Right above this resistance zone may be a good entry point. There is a support zone below the current price at 79.61, a Stop Loss order could be placed below this zone.
How to trade CSGP?
A breakout could materialize when the stock breaks out to new highs above the current consolidation zone. One could wait for this to happen and buy when this happens. A stop loss could be placed below the consolidation zone.
This article should in no way be interpreted as trading advice. You should always make your own analysis and trade or not trade based on your own observations and style. The article is based purely on some technical observations.
Every day, new breakout setups can be found on ChartMill in our Breakout screener.
Keep in mind
This is not investing advice! The article highlights some of the observations at the time of writing, but you should always make your own analysis and invest based on your own insights.