
For investors who use charts and price action to guide their decisions, the search often comes to two basic questions: which stock is in a strong trend, and when is the right time to buy it? A methodical way to answer these questions involves looking for stocks that mix sound technical condition with a high-grade consolidation pattern, hinting at a possible breakout. This process selects for securities with a high ChartMill Technical Rating, pointing to a firm existing trend, and a high ChartMill Setup Quality Rating, implying the stock is moving in a narrow band and could be ready for its next upward move.
CNX Resources Corp (NYSE:CNX), an Appalachian-focused natural gas producer, currently shows a profile that matches this breakout search method. According to its latest technical report, the stock gets good scores on both main measures, making it a candidate for technical investors to review.
Technical Strength: The Base of the Trend
The first part of a breakout setup is a stock's existing technical condition, which tries to find stocks already in a verified uptrend. A high Technical Rating implies the stock is a market leader with good momentum across several time periods. For CNX, the technical view is clearly positive.
- Trend Agreement: Both the near-term and longer-term trends for CNX are marked as positive. This agreement across time frames is a strong sign, showing continued buying pressure instead of a temporary rise.
- Moving Average Backing: The stock's price is above its important moving averages, including the 20-day, 100-day, and 200-day Simple Moving Averages (SMAs). This ordered layout, with nearer-term averages above farther-term ones, is a standard feature of a sound uptrend.
- Relative Performance: When measured against the wider group of stocks, CNX is displaying steady condition. It is doing better than about 79% of all stocks over the last year, a mark of notable relative momentum. While it trades in the higher section of its own 52-week range, it is worth noting that it is somewhat behind the S&P 500, which is close to new highs, leaving space for possible improvement.
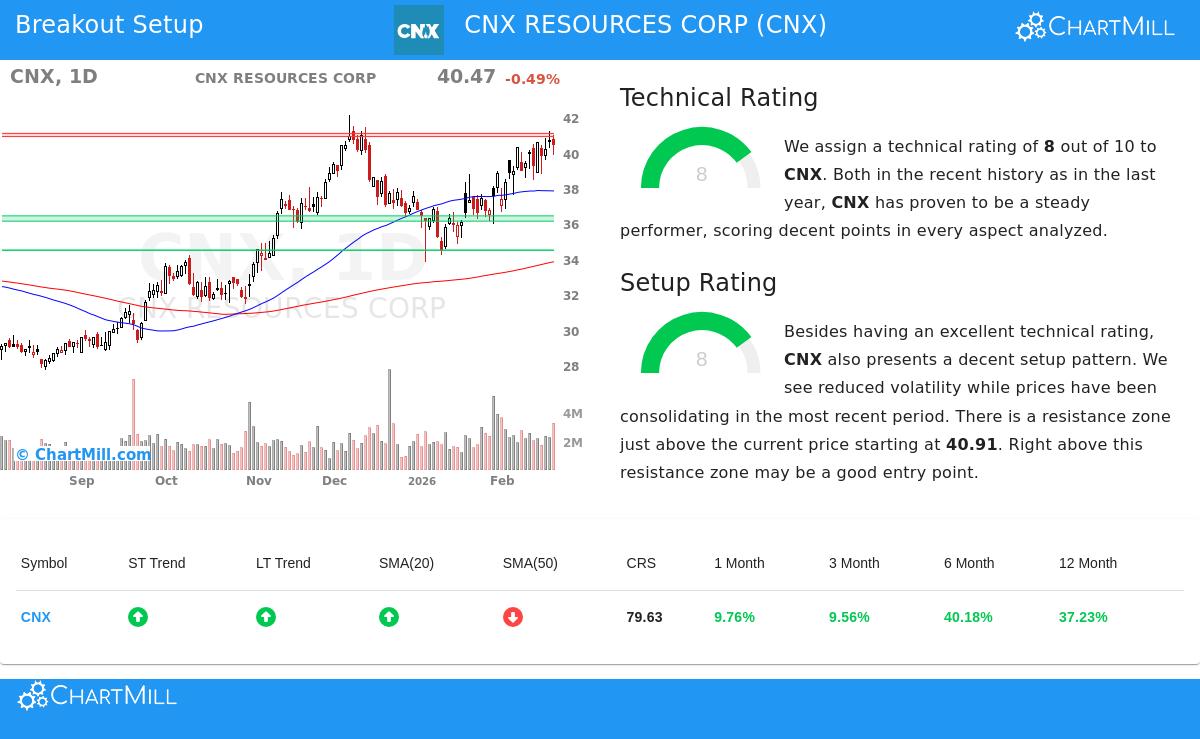
This mix of elements gives a ChartMill Technical Rating of 8 out of 10. This number verifies that CNX is in a technically sound position, meeting the "which stock" need by showing it is in a clear uptrend that deserves a trader's notice.
Setup Quality: Finding the Entry Chance
A strong trend by itself is not a buy signal; entering a stock that has just had a big, stretched move can lead to quick declines. The second part, then, is the grade of the setup. A high Setup Rating searches for consolidation—a time where the stock absorbs its recent gains in a narrow band, forming a base for the next rise. This creates clear risk limits with specific support and resistance points.
CNX's present chart activity shows several signs of a good setup, giving it a Setup Rating of 8.
- Consolidation Shape: The technical report states that CNX has been moving in a band between about $35.98 and $41.25 over the last month. While this band is fairly broad, the stock is now trading near the top of this area, with movement having lessened lately—a typical event before a breakout.
- Specific Resistance and Support: The analysis finds a definite resistance area just above the present price, from $40.91 to $41.09. A clear move above this area could mark the beginning of a new upward stage. On the other hand, several support levels are set below, including an important zone between $36.13 and $36.43, giving a reasonable place for a protective stop-loss order.
- Automated Trade Idea: Based on this form, the technical analysis proposes a possible breakout entry at $41.10 (just above resistance) with an exit stop at $38.44. This sets a clear and measured risk of about 6.5% on the trade, allowing for exact position planning.
This setup answers the "when to buy" question by pointing out a particular price level where a breakout might happen, offering a structured entry point with a controlled risk outline.
Conclusion and Next View
CNX Resources Corp offers a notable example for the breakout search method. It has the needed technical condition, with a rating of 8 confirming its place in a maintained uptrend. At the same time, its setup rating of 8 shows it is not stretched but is instead consolidating near a specific resistance level, providing a clear chance for a possible breakout. For technical traders, this mix of trend and signal is a main pattern to watch.
It is vital to recall that technical shapes show likelihoods, not guarantees. Any trade should include good risk control, using stop-loss orders, and think about wider market states and basic news, like coming earnings reports or commodity price changes.
Want to find more possible breakout setups like CNX? You can use the same search each day with our Technical Breakout Setups screener to sort the market for other stocks displaying high technical and setup ratings.
Disclaimer: This article is for information only and is not investment advice, a suggestion, or an offer to buy or sell any security. The analysis and trade ideas shown are based on technical indicators and are not assured. You should do your own study and talk with a qualified financial advisor before making any investment choices. Investing has risk, including the possible loss of principal.