
Investors looking to join solid technical trends with solid fundamental growth often consider methods that join both fields. One method is shown by the strategies made known by trader Mark Minervini, which stress finding stocks in strong uptrends, checked by a particular group of moving average and momentum rules, while also requiring quickening earnings and sales growth. This two-part filter tries to catch leaders early in their large price increases. A stock that recently appeared through a scan joining Minervini's Trend Template with a High Growth Momentum (HGM) score is Ciena Corp (NYSE:CIEN).
Checking the Technical Trend
For a stock to pass under Minervini's Trend Template, it must show a clear and matched uptrend across several time periods. This is not only about being above a moving average; the rules need a particular order of strength to confirm institutional buying and a lasting rise. Ciena's present chart position shows a strong match with these strict technical rules.
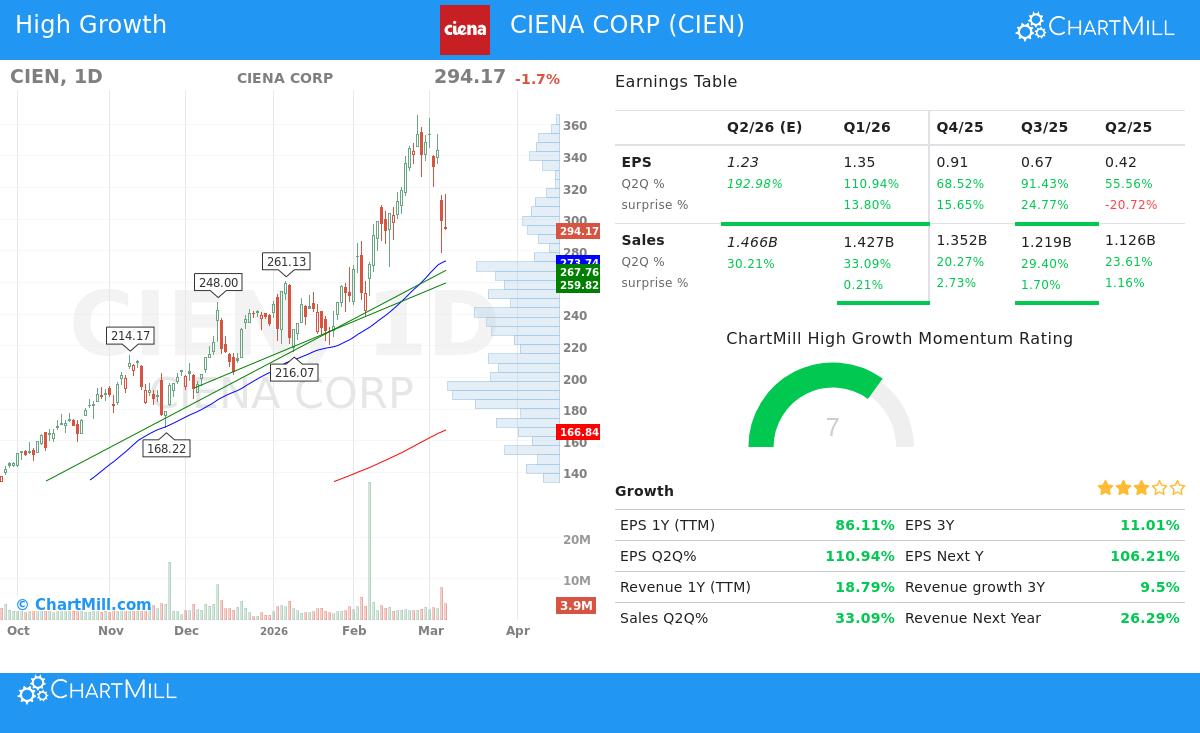
- Price vs. Long-Term Averages: The stock's last price of $294.17 rests well above its important long-term moving averages. Importantly, it is above both the rising 150-day SMA ($195.56) and the 200-day SMA ($166.84), meeting the main needs for a long-term bullish stage.
- Moving Average Order: The template needs the shorter-term averages to guide the trend. CIEN's 50-day SMA ($273.74) is placed above both the 150-day and 200-day averages. Also, the 150-day average itself is above the 200-day average, making the wanted bullish order that shows steady buying pressure.
- Nearness to Highs: A sign of leading stocks is their skill to trade near new highs. CIEN is now within 25% of its 52-week high of $365.90, and it has risen more than 30% from its 52-week low of $49.21, in fact, it has climbed nearly 500% from that low, showing great momentum.
- Relative Strength: Maybe most revealing is the stock's relative strength (RS) rank of 98.81. This means CIEN is doing better than nearly 99% of all stocks in the market over the past year, a key part of Minervini's view on market leaders. Solid RS shows that the stock is wanted no matter wider market changes.
This meeting of technical points indicates CIEN is in a clear Stage 2 uptrend, the main point of the strategy where the largest gains are often taken.
Checking the High Growth Momentum
The technical move is only one part. For the move to have basic truth and lasting force, it should be backed by solid and quickening business results. The High Growth Momentum score checks exactly this, looking at earnings growth, sales growth, estimate changes, and profit margins. Ciena's recent financial numbers show a company in a solid growth cycle.
- Large Earnings Growth: The company is showing notable profit increase. Year-over-year EPS growth for the trailing twelve months is at 86.1%. Even more notable is the recent three-month period, with the last quarter showing a 110.9% rise in EPS compared to the same quarter last year.
- Solid and Quickening Sales: Top-line growth gives the fuel for kept earnings. CIEN's revenue growth is solid, with TTM sales up 18.8%. The most recent quarter saw sales jump 33.1% year-over-year, showing a quickening in the business path.
- Analyst Belief: Forward-looking estimates show large upward changes. Analyst agreement for next year's EPS has been changed upward by 22.5% over the last three months, and revenue estimates have been raised by 8.1%. This growing positive view from analysts often comes before continued institutional interest.
- Earnings Soundness: The company has passed EPS estimates in three of the last four quarters by an average of over 18%, showing a steady habit of under-promising and over-delivering, a good sign for growth investors.
This basic picture matches the idea that "big earnings draw big attention." The joining of solid technicals and strong basics makes a possible SEPA (Specific Entry Point Analysis) setup, where a catalyst-driven stock in a clear uptrend shows a clear chance.
Technical Condition Summary
ChartMill's own analysis gives a short summary of CIEN's technical position. The stock gets a perfect Technical Rating of 10/10, reflecting its unusual trend strength and market-leading results. It has a long-term positive trend and does better than 98% of the market and 91% of its Communications Equipment industry group. The report notes three set support zones below the present price, which can help set risk levels. However, it also gives a lower Setup Rating of 3/10, showing that after its large rise, the stock is now stretched and not in a tight holding pattern good for a new low-risk entry. This indicates that while CIEN shows the traits of a solid leader, investors may need to wait for a time of volatility lessening or a drop to a support level for a more ideal setup following the strategy's careful entry ideas. You can see the full, detailed technical report for CIEN here.
Finding Like Chances
Ciena Corp shows a case study in how the joining of trend-following and growth momentum rules can find high-potential equities. For investors interested in scanning for other stocks that meet this joined set of strict technical and basic filters, the preset scan is ready for use. You can find more possible picks by running the "High Growth Momentum + Trend Template" scan here.
Disclaimer: This article is for information and learning only. It is not a suggestion to buy or sell any security. The analysis is based on given data and certain methods, but past results are not a sign of future results. Always do your own checking and think about talking with a qualified financial advisor before making any investment choices. Please read our full disclaimer here.