
A strategy that mixes basic financial soundness with price trend signals gives investors a wide-ranging method for spotting potential chances in the stock markets. This process centers on firms showing good core business condition and expansion possibilities, as seen through financial examination, while also displaying encouraging price movement and breakout formations on their charts. By needing both a firm monetary base and positive chart structure, this method aims to match the qualitative narrative of a firm's results with the numerical truth of market feeling, possibly finding stocks set for further growth.
Fundamental Strength and Growth Profile
Boot Barn Holdings Inc (NYSE:BOOT) shows a convincing fundamental argument, which is important for any expansion investment as it points to a sound, enlarging enterprise able to maintain its course. The firm's financial statements show a firm operational structure.
- High Profitability: Boot Barn receives a top Profitability Rating of 8 out of 10. Important margins are best in their field, with a Profit Margin of 10.05% and an Operating Margin of 13.34%, doing better than about 90% of similar companies in the Specialty Retail industry.
- Firm Financial Condition: The company holds a good Health Rating of 7. It has no remaining debt, a positive sign of balance sheet soundness, and an Altman-Z score of 5.50, indicating a very small short-term chance of monetary trouble.
- Notable Past Expansion: The Growth Rating of 7 is backed by forceful past results. Over the last year, Earnings Per Share (EPS) increased by 35.74%, while Revenue went up by 17.82%. The multi-year averages are also firm, with EPS increasing at 28.69% and Revenue at 17.71% each year.
This mix is necessary for an expansion stock, as it shows the firm is not just enlarging its sales and profits at a quickened rate but is doing so with good profits and from a state of monetary steadiness. You can examine the full details in the complete fundamental analysis report for BOOT.
Technical Breakout and Market Momentum
While fundamentals explain the company's motor, technical examination evaluates the market's response to that performance. Boot Barn's technical view is very firm, matching its fundamental scores and indicating positive market movement.
- High-Level Technical Rating: The stock has a best-possible technical rating of 10 out of 10, showing steady firmness across many time periods.
- Firm Relative Performance: Boot Barn has done better than 86% of all stocks over the past year and sits in the top 10% of its industry, showing important relative firmness.
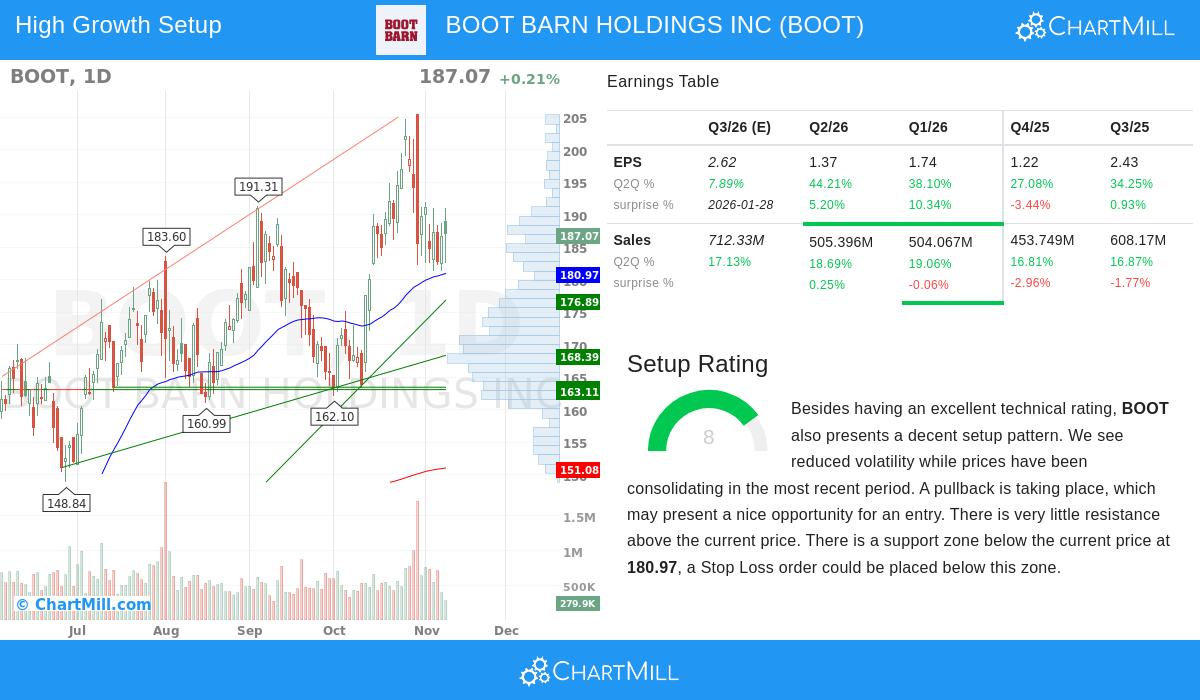
- Orderly Price Movement: The long-term direction is positive, and the stock is now settling inside a recent price band. This time of lower price swings often comes before a new price move, and with little price ceiling above, the chance for a move higher exists.
The technical formation is considered acceptable, with a Setup Rating of 8, showing that the present price settling may give a possible point of entry. The existence of set price floors under the present price aids in handling possible risk of loss. The full technical view, including support areas and trade formation specifics, is found in the full technical analysis report for BOOT.
Synthesis: A Converging Opportunity
The attraction of Boot Barn within the frame of a mixed fundamental and technical plan is evident. The company’s excellent profitability and lively expansion meet the "firm growth" part of the filter, making sure the investment is supported by a high-grade enterprise. At the same time, its top technical rating and orderly chart formation satisfy the "positive technical formation" need, indicating the market is recognizing this fundamental firmness and could be getting set for a next step up. This meeting is the main goal of the strategy, to locate firms where the narrative told by the financials is being affirmed by the movement in the stock price.
For investors wanting to find other companies that fit this strict standard of firm growth fundamentals paired with positive technical formations, more study can be done using the Strong Growth Stock Technical Setups screen on ChartMill.
Disclaimer: This article is for informational purposes only and does not constitute financial advice, a recommendation, or an offer or solicitation to buy or sell any securities. The information presented should not be used as the sole basis for any investment decision. All investments involve risk, including the possible loss of principal. Past performance is not a guarantee of future results. Readers should conduct their own research and consult with a qualified financial advisor before making any investment decisions.