
For investors focused on chart patterns and momentum, a systematic method for spotting possible trades can simplify the search for opportunities. One approach looks for stocks that show both good technical condition and a positive price formation, indicating a possible price move. This method depends on two specific metrics: the ChartMill Technical Rating, which measures a stock's trend force and momentum, and the ChartMill Setup Quality Rating, which evaluates the state of its present price pattern. The aim is to locate stocks with good technicals that are tightening their price range, possibly ready for their next upward move.
BANK OF NOVA SCOTIA (NYSE:BNS) recently appeared from such a search, presenting an interesting case for technical investors. The Canadian banking firm, which offers personal, commercial, corporate, and investment banking services worldwide, is now showing a solid technical picture along with a positive formation.
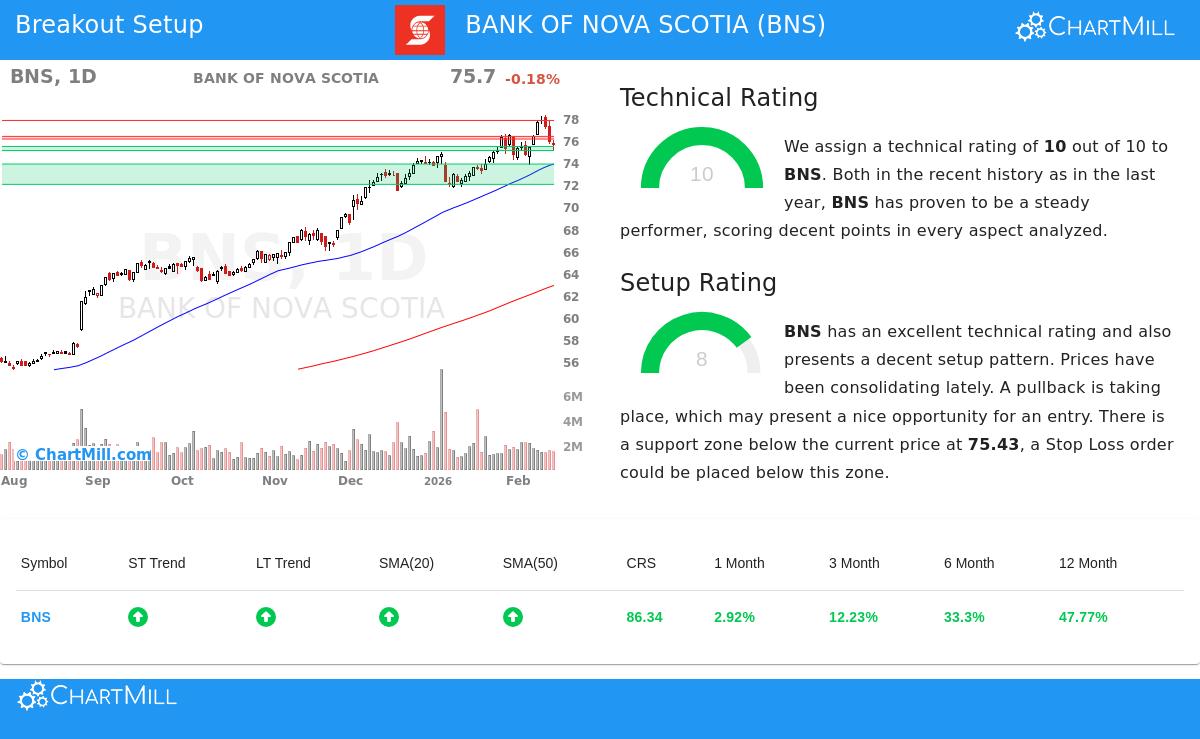
Technical Strength: A Base of Momentum
The main filter in a breakout search is a high Technical Rating, as it confirms the stock is in a clear uptrend and doing better than similar stocks, a key base for any momentum trade. BANK OF NOVA SCOTIA does very well here, receiving a top rating of 10 out of 10. The detailed technical report notes several parts of this condition:
- Trend Direction: Both the short-term and long-term trends for BNS are rated as positive. This agreement across time periods is a strong sign of continued buying.
- Relative Performance: The stock's yearly performance is better than 86% of all stocks in the market and 86% of its peers in the Banks industry. This shows clear relative condition.
- Moving Average Support: The stock's price is above all its main simple moving averages (20, 50, 100, and 200-day), and each average is also rising. This layered support is a typical sign of a good uptrend.
- Near Highs: BNS is trading close to its 52-week high of $78.28, confirming the condition of its current rise.
This group of factors supports the stock's inclusion based on the first important search condition: finding a market leader with strong, confirmed momentum.
Setup Quality: The Formation for a Possible Price Move
A strong trend alone is not a signal to buy; entering a stock that is "overbought" can lead to quick declines. This is where the Setup Quality Rating is important, finding times of price tightening within the uptrend that offer a more defined entry. BNS shows a Setup Rating of 8, signaling a good price pattern.
The analysis indicates a stock that has been gathering energy for a possible move:
- Recent Tightening: Over the last month, BNS has traded between about $72.93 and $78.28. It is now moving in the middle of this range, which the report states "may offer a good entry point."
- Clear Support and Resistance: The formation is bounded by specific price levels. A support area is found between $75.06 and $75.43, made by a mix of trendlines and moving averages. Just above, a resistance area is between $76.10 and $76.34.
- A Specific Setup Example: The technical report turns this pattern into a particular, automated trade idea for demonstration. It suggests an entry if the price moves above resistance at $76.35, with a stop-loss set below the support area at $75.05. This sets a close risk limit of about 1.7%.
This organized situation, with price moving between clear support and resistance, is what the Setup Rating is made to find. It gives a planned structure for investors seeking a measured entry into a strong trend.
Conclusion and Next Steps
BANK OF NOVA SCOTIA shows the kind of opportunity a combined technical and setup search tries to find: a large, liquid company displaying both strong relative condition and a positive, usable chart pattern. The top Technical Rating of 10 confirms its leader position, while the Setup Rating of 8 points to a possible decision point.
For investors wanting to see similar technical breakout formations, new possibilities are found each day. You can see the present list of matching stocks by visiting the Technical Breakout Setups screen.
Disclaimer: This article is for informational purposes only and does not constitute investment advice, a recommendation, or an offer or solicitation to buy or sell any securities. The trading setup mentioned is an automatically generated example for educational illustration and is not a recommendation. All investing and trading involves risk, including the potential loss of principal. Always conduct your own due diligence and consider consulting with a qualified financial advisor before making any investment decisions. Past performance is not indicative of future results.