
For investors looking to join solid fundamental growth with well-timed technical entries, a method concentrating on strong growth momentum and breakout formations can work. This method selects for companies showing very high earnings and sales increases—important for momentum investors—while also spotting those in a period of technical sideways movement, giving a possible entry point for a new upward move. The aim is to locate stocks where forceful fundamental momentum matches a price chart that is ready to advance, trying to seize the next part of an upward trend.
BKV Corporation (NYSE:BKV), a Denver-based natural gas producer, recently came from such a filter, fitting the requirements of a High Growth Momentum (HGM) Rating above 4, a Technical Rating above 7, and a Setup Rating above 7.
High Growth Momentum Fundamentals
The center of the high growth momentum method is finding companies with speeding up business results. BKV’s recent financial reports display the sort of sharp growth that pushes this approach. The company’s earnings per share (EPS) growth over the past twelve months (TTM) is at a very high 218%, while revenue growth is a solid 78%. More significant for momentum, the newest quarterly comparisons show very high speeding up:
- EPS Growth (Q2Q): 2,800%
- Sales Growth (Q2Q): 176%
This very high quarterly performance points to a major turning point in profitability. Also, the company has a good history of beating analyst predictions, with an average EPS surprise of over 102% across the last four quarters. Positive analyst changes to next-year revenue estimates (up 13.8% in three months) add more support to the fundamental momentum story. While free cash flow is still negative and profit margins have fallen from the earlier quarter, the very strong top-line growth and bottom-line surge is what the HGM rating measures, giving BKV a good score of 6 in this group.
Technical Strength and Market Position
Apart from fundamentals, a stock needs to be in a good technical upward trend to be considered a leader. According to ChartMill’s technical analysis report, BKV gets a high 8 out of 10 for technical condition. The long-term trend is scored as positive, and the stock has been a significant market performer, doing better than about 86% of all stocks over the past year. It is trading in the higher part of its 52-week range, matching the wider S&P 500.
Important technical good points include:
- A positive long-term trend with price above rising 50, 100, and 200-day simple moving averages.
- High relative strength, showing institutional interest and market leadership.
- Several set support areas between $21.27 and $29.09, giving clear levels for risk management.
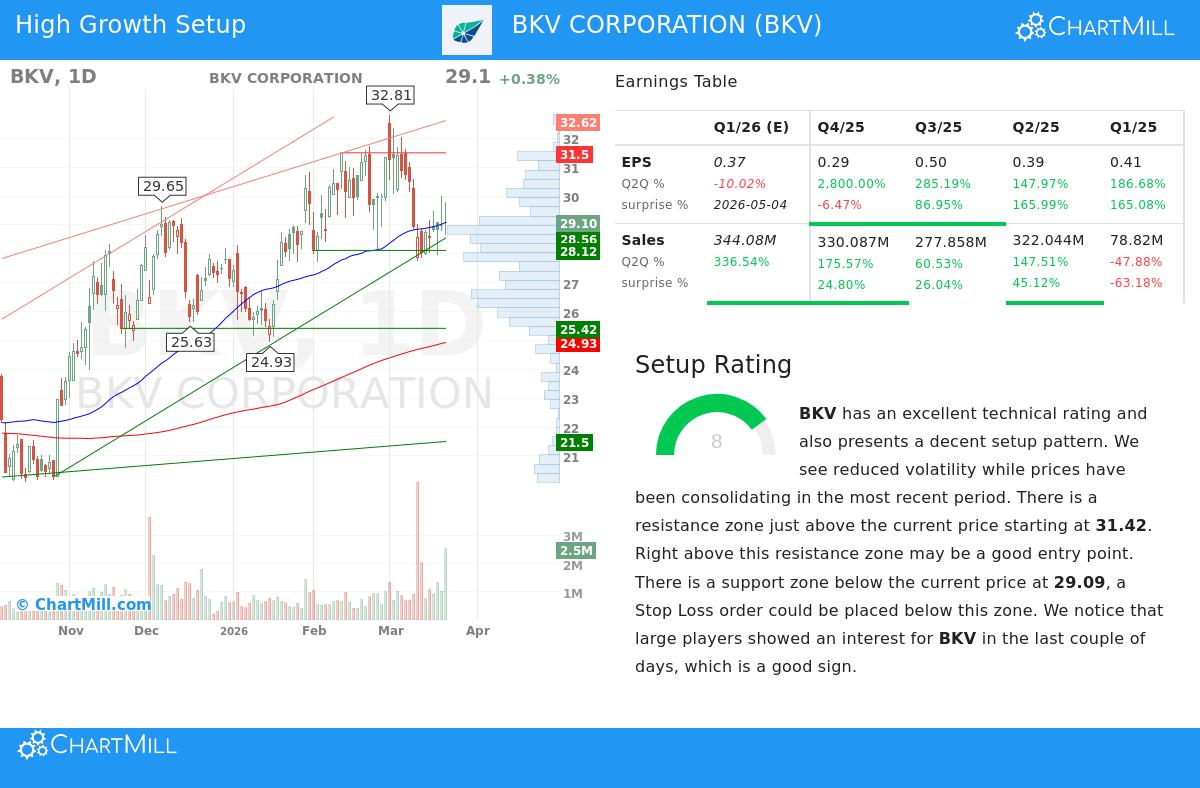
A Quality Breakout Setup
A high technical rating by itself is not a signal to buy; it must be combined with a constructive pattern. This is where the Setup Rating of 8 becomes key. The report states that BKV's price has been moving sideways recently with lower volatility, making a possible base. A clear resistance area is found between $31.42 and $31.50. The setup proposes that a clear move above this resistance could indicate a breakout and the start of a new upward move.
The existence of a narrow sideways movement near highs, joined with noted attention from large investors (as measured by the Effective Volume indicator), makes the sort of "spring-loaded" situation breakout traders look for. It provides a specific entry point (above resistance), a sensible stop-loss level (below the nearby support area), and a technically sound stock in which to take the trade.
Finding Similar Opportunities
BKV Corporation shows a case where solid fundamental momentum meets a technically sound price chart pattern. For investors using this joined method, it serves as an example of the search for companies going through a forceful business speed-up while their stock charts become tight, hinting at a possible follow-on of the trend.
To find more stocks that match this description of high growth momentum and technical breakout formations, you can run the filter yourself here: High Growth Momentum Breakout Setups Screen.
,
Disclaimer: This article is for informational purposes only and does not constitute investment advice, a recommendation, or an offer to buy or sell any security. The analysis is based on data provided and should not be the sole basis for any investment decision. Always conduct your own due diligence and consider consulting with a qualified financial advisor before making any investment. Past performance is not indicative of future results.