
For investors who use charts and price action to make choices, a methodical process can help sort the market's distractions. One such process involves searching for stocks that are both technically sound and creating a consolidation pattern, indicating a possible breakout is near. This method depends on two main proprietary scores from ChartMill: the Technical Rating, which measures the general condition and direction of a stock, and the Setup Quality Rating, which judges how narrow and clear its recent price movement has been. By concentrating on securities that rate well on both measures, technical investors try to find leading stocks that are resting before their next possible move upward.
BANK OF NEW YORK MELLON CORP (NYSE:BK) recently appeared from such a search, displaying a profile that calls for more examination from a pattern-trading viewpoint.
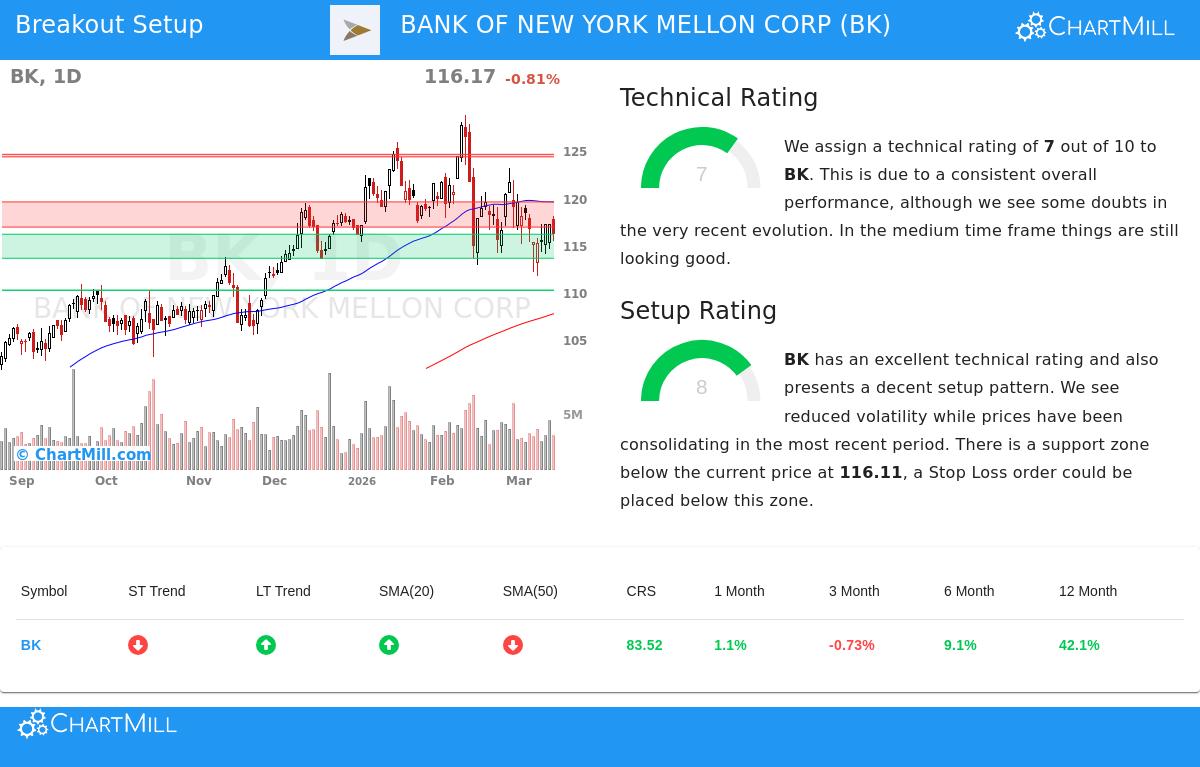
Looking at the Technical Base
The heart of this breakout method starts with finding stocks in a verified uptrend, as a firm existing trend raises the chance that a breakout will follow the current direction. BANK OF NEW YORK MELLON CORP’s Technical Rating of 7 out of 10 shows a firm technical base. This number comes from a study of several items, including relative strength, moving averages, and trend consistency across various time periods.
A look at the detailed technical report shows several confirming data points:
- The stock’s long-term direction is labeled positive, an important setting for any bullish formation.
- It shows firm relative performance, doing better than 83% of all stocks over the last year and 89% of its group in the Capital Markets industry.
- Important moving averages tell a positive story: the price is above the climbing 100-day and 200-day simple moving averages, which frequently serve as changing support in good trends.
While the short-term direction is marked as negative, making some near-term uncertainty, the medium- to long-term view stays positive. This mix of firm yearly performance and a positive long-term direction fits exactly with the method's first filter, looking for technically "firm" stocks where the main momentum is upward.
Judging the Setup Quality
A firm trend by itself is not a buy signal; entering a stock that has just completed a big, stretched move often results in buying at a high. This is where the Setup Quality Rating becomes key. It finds times of consolidation or "narrow" trading, where volatility lessens and the stock forms a base. These stages often come before the next directional move. BK’s Setup Rating of 8 is particularly high, showing that such a constructive pattern is happening.
The technical report gives solid proof of this consolidation:
- Over the last month, BK has traded in a band between about $111.71 and $123.14. At this time, the price is consolidating in the middle of this band, which the study indicates "may offer a good entry chance."
- The setup summary clearly states "lessened volatility while prices have been consolidating in the most recent period."
- A clear support area is found between $113.56 and $116.11, giving a reasonable zone below the current price to set a protective stop-loss order.
This high setup number answers the method's second question: "When should I buy it?" It shows the stock is not stretched but is instead tightening, possibly gathering force for its next move. The existence of specific support and resistance levels allows for a careful trade plan with measured risk.
Trade Plan and Market Setting
Based on its ratings, a sample trading plan is created. It proposes an entry point just above a close resistance zone at $119.55, with a stop-loss order set below the support zone at $113.55. This describes a risk of about 5% on the trade. For a portfolio-level risk management method, this means assigning a certain part of capital to keep the total portfolio risk controlled.
It is necessary to see this possible plan inside the wider market condition. Right now, the S&P 500's long-term direction is negative, while its short-term direction is neutral. BK’s ability to keep a positive long-term direction and a high setup number during a difficult market index shows clear relative strength, which can be a good characteristic.
Locating Comparable Chances
BANK OF NEW YORK MELLON CORP shows the kind of chance technical breakout screens are made to find: a stock with confirmed existing strength taking a break that may come before a continuation. Investors wanting to see a new list of securities that fit similar conditions of firm technicals and high-quality setups can find them each day by going to the Technical Breakout Setups screen.
Disclaimer: This article is for information only and does not form investment advice, a suggestion, or an offer or request to buy or sell any securities. The trading plan talked about is an automatically made sample for learning illustration and is not a suggestion. All investing and trading includes risk, including the possible loss of principal. Always do your own research, think about your personal money situation and risk comfort, and talk with a qualified financial advisor before making any investment choices. Past results are not a guide for future results.