
For technical investors, finding stocks that have good fundamentals and are set for a short-term price change is a constant goal. One way to simplify this search is by using a combined technical filter, focusing on two specific scores: the ChartMill Technical Rating and the Setup Quality Rating. The Technical Rating (0-10) judges the general condition and trend strength of a stock, with scores of 7 or more showing a good uptrend. The Setup Quality Rating (0-10) examines the chart pattern, searching for periods of consolidation that offer defined entry and exit points. A high score here means the stock is tightening, possibly set for its next price move. By looking for stocks that rate well on both measures, investors can find candidates that are not only trending well but also seem to be forming clear breakout patterns.
Technical Strength: A Good Base
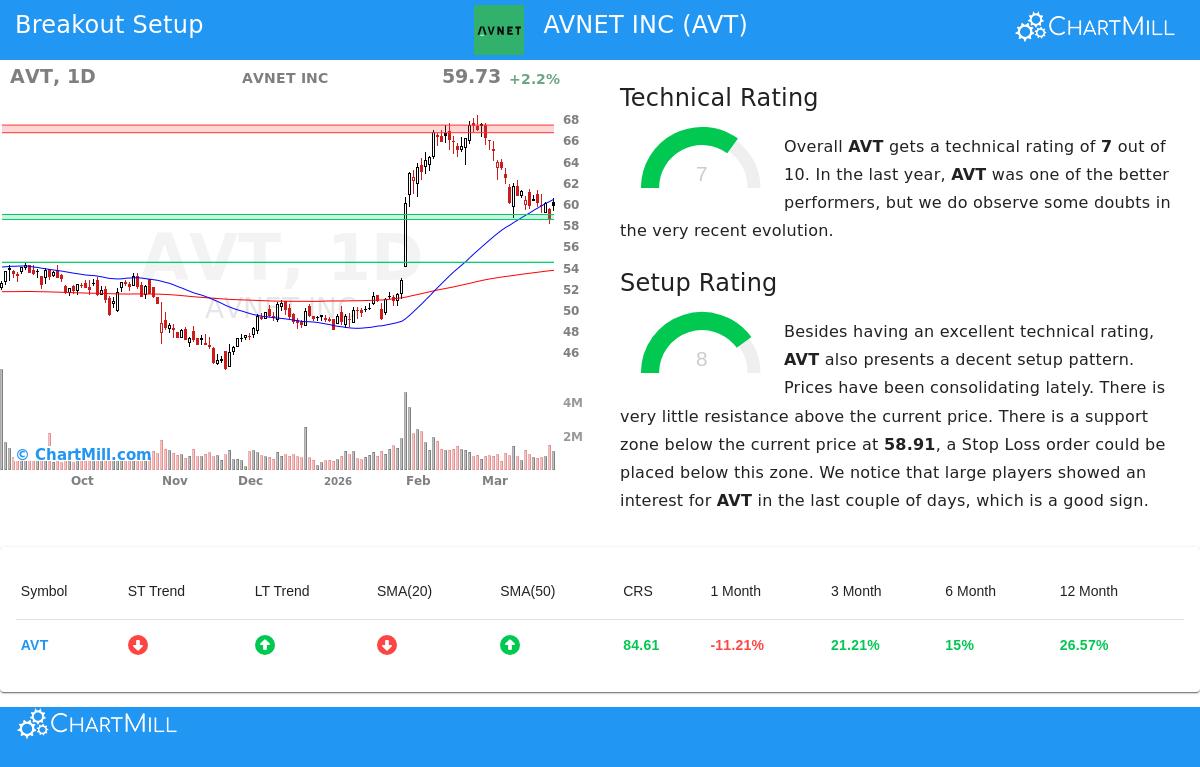
Avnet Inc (NASDAQ:AVT) appears from this screen with a Technical Rating of 7, putting it clearly in the group of stocks showing a positive technical condition. This score is important for the breakout plan, as it makes sure we are examining potential breakouts in the direction of the existing trend, instead of trying to buy a declining stock or go against momentum.
A closer examination of the technical report for AVT shows the basis for this score:
- Long-Term Trend: The long-term trend stays positive, a main support for lasting moves.
- Relative Strength: In the last year, AVT has done better than 84% of all stocks, showing clear market strength.
- Position vs. Market: The stock is trading in the higher part of its 52-week range, matching the S&P 500 which is also in the higher part of its range. This indicates AVT's strength is happening alongside the wider market.
- Moving Average Alignment: The stock trades above its important longer-term moving averages (50, 100, and 200-day), which usually act as support in good uptrends.
However, the report also mentions a point for care: the short-term trend has recently become negative. This creates a situation where a solid long-term uptrend is seeing a short-term pause or consolidation, often the exact condition that creates a good breakout chance if the longer-term trend continues.
Setup Quality: The Tightening Before the Move
While technical strength shows us which stock to monitor, the Setup Quality rating helps answer when to think about an entry. AVT scores an 8 on this measure, meaning a good consolidation pattern. This is the center of the breakout method; we look for stocks that are pausing after a move, letting volatility decrease and building pressure for the next upward step.
The analysis points out several elements adding to this positive setup:
- Price Consolidation: The stock has been trading in a range over the last month, letting it absorb its earlier gains.
- Clear Support Zone: A defined support area exists between $58.44 and $58.91, made by a mix of trendlines and moving averages. This gives a sensible level for setting a protective stop-loss order.
- Limited Overhead Resistance: The main resistance zone is seen between $66.62 and $67.34. A clear move above this area could indicate a true breakout and the start of a new upward stage.
- Institutional Interest: The report mentions that large traders have shown interest in AVT in recent days, as seen by the Effective Volume indicator. This can be a supporting sign that informed money is taking a position during the consolidation.
A Possible Trading Plan
Based on this combined study, the technical report proposes a specific, though example-only, setup. The suggested trade would involve an entry on a breakout above the recent range at about $62.18, with a stop-loss set just below the noted support zone near $58.43. This sets the risk from the start, a key part of careful technical trading. It is important to remember this is an automated idea; investors should always adjust entry, exit, and position size to their own risk comfort and plan.
Finding More Ideas
The case of Avnet Inc shows how mixing trend and timing measures can sort the market for practical ideas. For investors wanting to see a new list of stocks that meet similar technical and setup conditions, new possible breakout setups are found each day. You can see the current results by going to the Technical Breakout Setups screen.
Disclaimer: This article is for information only and is not investment advice, a suggestion, or an offer to buy or sell any security. The analysis uses technical data and automated scoring models, which can change. All investment decisions carry risk, including the possible loss of the amount invested. Past results do not guarantee future outcomes. Always do your own research and think about talking with a qualified financial advisor before making any investment decisions.