
Investors looking to find high-potential stocks in strong uptrends frequently use systematic methods that mix strict technical and fundamental study. One such method is the strategy made known by Mark Minervini, a two-time U.S. Investing Champion. His method depends on the "Trend Template," a group of technical rules meant to find stocks in strong Stage 2 uptrends, and is joined by a concentration on companies showing very high fundamental growth. This pairing tries to catch leaders early in their major price increases. A recent scan using these two filters, Minervini's Trend Template for technical strength and a High Growth Momentum (HGM) rating for fundamental speed, has identified Ascendis Pharma A/S - ADR (NASDAQ:ASND) as a candidate for more review.
Checking the Technical Trend
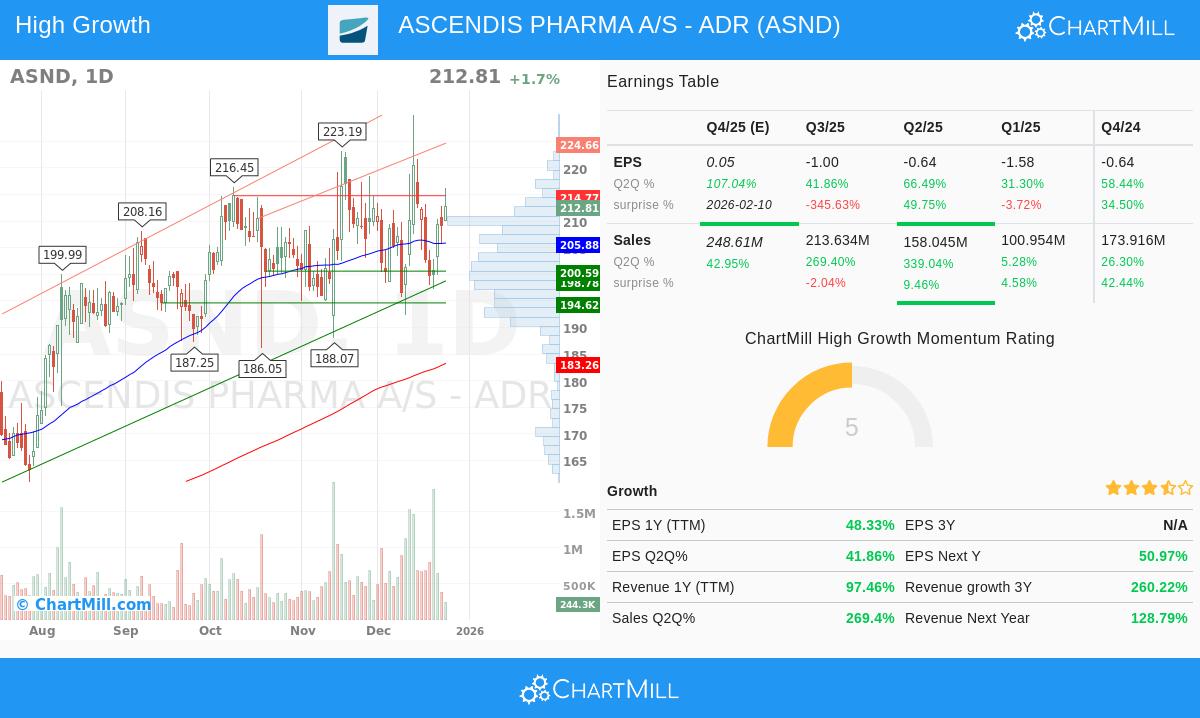
The main part of Minervini's strategy is the Trend Template, which checks a stock is in a verified, multi-timeframe uptrend before study. This removes weak or basing stocks and focuses money on stocks where the path of least resistance is clearly higher. A look at ASND's chart and key numbers shows it meets these strict technical needs.
- Price Above Key Moving Averages: The stock's current price is trading well above its rising 50-day ($205.88), 150-day ($191.70), and 200-day ($183.26) simple moving averages (SMAs). This order is a main sign of continued bullish momentum across short, intermediate, and long-term timeframes.
- Moving Average Order: The 50-day SMA is above both the 150-day and 200-day SMAs, and the 150-day SMA is above the 200-day SMA. This step-by-step "stacking" of averages confirms a strong and arranged uptrend, a key filter in the Minervini process.
- Nearness to Highs: ASND is trading within 25% of its 52-week high of $229.94, a key Minervini rule that prefers strength over "cheap" stocks. At the same time, the current price is about 80% above its 52-week low, showing a major recovery and set uptrend.
- Better Relative Strength: With a ChartMill Relative Strength (CRS) score of 89.48, ASND is doing better than nearly 90% of the wider market. Minervini states that true market leaders show high relative strength, often breaking out before the general market indices.
Checking the Growth Driver
While a strong chart is needed, Minervini's strategy looks for the cause behind the move: better fundamental growth. The High Growth Momentum rating checks the speed and quality of a company's financial growth. ASND's basic numbers show the strong growth story supporting its technical breakout.
- Very High Revenue Speed: The most notable number is the trailing twelve-month (TTM) revenue growth of over 97%. More importantly, recent quarterly growth rates show major speed increase, with the last quarter's sales jumping 269% year-over-year. This type of very high top-line growth is a sign of companies taking major market share or selling new therapies.
- Earnings Speed: The company is on a clear path toward profit gain. The EPS growth rate for the last quarter was 41.9%, and analysts have increased their earnings estimates for the next year by over 3% in the last three months, showing more confidence. The company has also passed revenue estimates in three of the last four quarters.
- Operational Improvement: Although the company is not yet profitable on a net basis, the direction in key numbers is good. Free Cash Flow has gotten better by over 80% in the past year, a sign of improving capital use as revenues grow.
Combination: The Setup and Risk Points
When the strong technical trend described by the Trend Template meets the fundamental growth force of high growth momentum, it creates the type of setup Minervini's SEPA (Specific Entry Point Analysis) method looks for. The technical report for ASND gives a perfect rating of 10, noting steady performance across all timeframes. Also, it finds a setup rating of 7, showing the stock is pausing within its uptrend, which can come before a new move higher. The report notes support areas near $209 and $205, which could act as logical places for risk management.
For a detailed look at the technical picture, including found support and resistance levels, you can see the full technical analysis report for ASND.
Finding Like Opportunities
ASND shows one example of a stock currently fitting with a strict growth and momentum strategy. Investors wanting to find other securities that meet similar rules of strong technical trends and high fundamental growth momentum can run the same scan. You can find more possible candidates by using this pre-set scan on ChartMill.
Disclaimer: This article is for information and learning only. It does not make investment advice, a suggestion, or an offer to buy or sell any security. The study is based on current data and methods, which can change. Investing in stocks has risk, including the possible loss of principal. Always do your own study and think about talking with a qualified financial advisor before making any investment choices.