
For investors who use charts and price action to guide their choices, a methodical way to find possible opportunities can be very useful. One such technique looks for stocks that are both technically sound and making a constructive price pattern, a pairing that can indicate a preparation for a new move upward. This method centers on two specific metrics: the ChartMill Technical Rating, which judges the general condition and direction of a stock, and the ChartMill Setup Quality Rating, which judges the condition of its present consolidation pattern. The aim is to find stocks in clear upward trends that are pausing, giving a more distinct entry point with clear risk.
Associated Banc-Corp (NYSE:ASB) recently appeared from such a scan, showing a profile that technical investors may find interesting. The Wisconsin-based bank holding company, serving customers across the Midwest, seems to be forming a base after a time of upward movement.
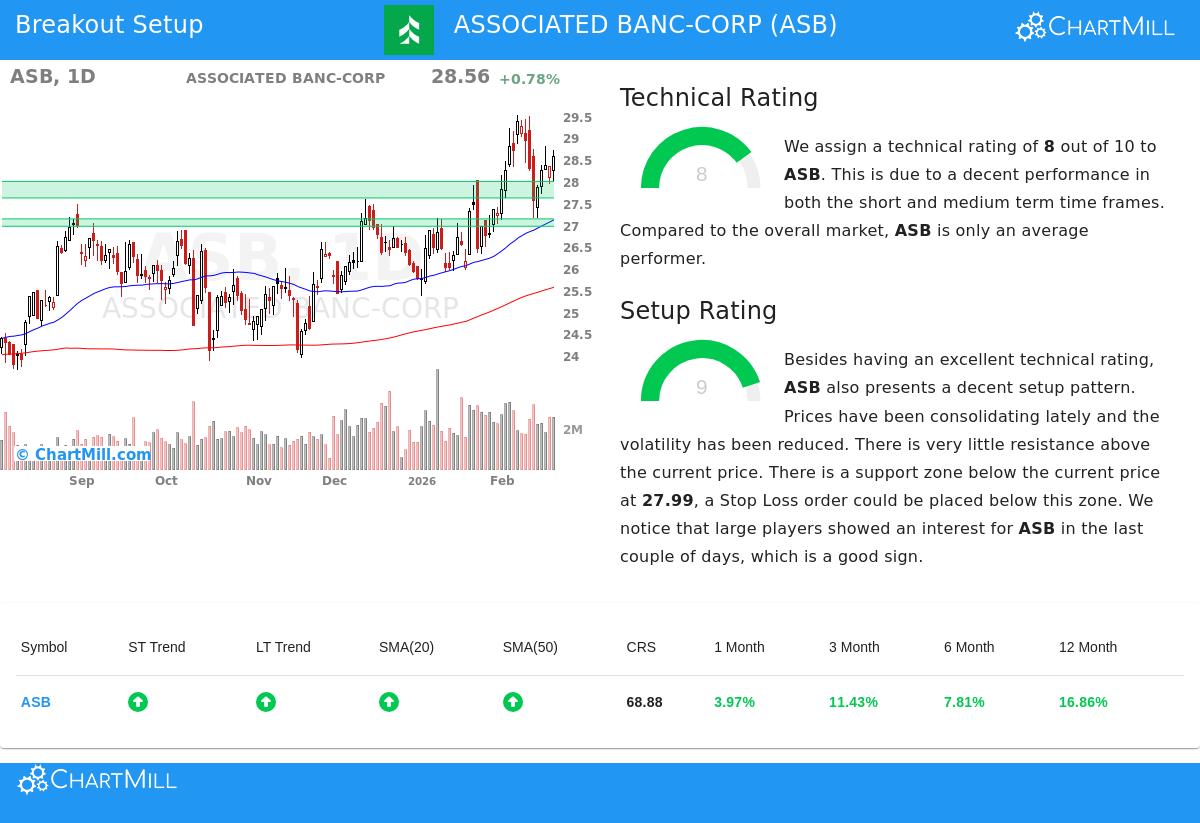
Technical Strength: A Good Base
The first part of this breakout method is finding stocks with sound underlying technicals. A high Technical Rating implies a stock is in a good upward trend and is a market leader, not one that is only rebounding. According to the detailed technical report, ASB gets a good rating of 8 out of 10. This number comes from several good points:
- Positive Trend Alignment: Both the short-term and long-term trends for ASB are rated as positive. This agreement across timeframes is a main sign of continued momentum and lowers the chance of mixed signals.
- Strong Moving Average Support: The stock's price is trading above all its main moving averages (20, 50, 100, and 200-day), and each of these averages is itself in a rising shape. This makes a layered support structure under the price.
- Respectable Relative Performance: While not a clear market leader, ASB has done better than 68% of all stocks over the last year and trades in the higher part of its own 52-week range. This shows it is taking part in the wider market's upward movement.
For a breakout method, this technical strength is essential. It gives the situation that the possible breakout is happening inside a continuing upward trend, raising the chance that an upward move could continue rather than quickly reversing.
Setup Quality: The Pattern for a Chance
A strong trend by itself is not a signal to buy; entering after a fast rise holds notable risk. This is where the Setup Quality Rating becomes very important. It answers the "when" by finding times of consolidation where volatility lessens and the stock builds energy for its next move. ASB gets a very good 9 out of 10 on this metric.
The analysis shows a stock that has been consolidating its recent gains, with lower volatility and prices trading in a set range. Specifically, the report states:
- Consolidation in a Range: Over the last month, ASB has traded between about $26.32 and $29.52, and it is now placed in the middle of this range. This coiling action is a typical pre-breakout behavior.
- Clear Support Zone: A well-set support zone is found between $27.61 and $27.99, made by a combination of trendlines and moving averages. This gives a logical area below the present price to place a protective stop-loss order, allowing for exact risk management.
- Institutional Interest: The report also notes that large players have shown interest in ASB in recent days, as measured by the Effective Volume indicator. This can be a confirming signal that the consolidation is drawing strategic accumulation.
The high setup score shows that ASB is not overextended; instead, it is giving a possible entry point with a nearby support level to set risk. The suggested automated setup from the report proposes an entry on a breakout above $29.53 (the recent range high) with a stop-loss just below the support zone at $27.60.
Finding More Possible Breakouts
The pairing of a Technical Rating of 8 and a Setup Rating of 9 is what brought ASB to attention. For investors looking to scan the market each day for similar arrangements in other stocks, this method is used in a systematic way. The Technical Breakout Setups scan continuously filters the market for securities that meet these two needs of strength and pattern.
You can view the present list of qualifying stocks and run this scan for yourself here: Technical Breakout Setups Screen.
It is important to recall that technical patterns show probabilities, not guarantees. Any trade based on such setups should include sound risk management, including the use of stop-loss orders. Also, investors should always know about fundamental events, such as coming earnings reports, which can change technical patterns.
Disclaimer: This article is for informational purposes only and does not constitute investment advice, a recommendation, or an offer or solicitation to buy or sell any securities. The analysis presented is based on technical metrics and should not be the sole basis for an investment decision. All investing involves risk, including the possible loss of principal. Always conduct your own research and consider your financial situation and risk tolerance before making any investment.