
For investors aiming to benefit from active market shifts, a method that combines solid core business expansion with positive chart formations can be especially interesting. The process requires first finding firms with good basic growth outlooks, confirming the business itself has forward motion. This is then combined with a chart study filter to locate shares that are resting or creating shapes that often come before large price advances. The aim is to locate investments where better business basics and a narrowing chart arrangement meet, possibly indicating a chance for price gains.
APELLIS PHARMACEUTICALS INC (NASDAQ:APLS) appears from such a filter process, offering a situation where its revenue-generating biopharmaceutical narrative meets a particular price chart shape.
The Basic Growth Narrative
At its heart, the filter method requires solid expansion, and Apellis meets this with significant numbers. The firm's change to a revenue-generating organization, powered by its main product SYFOVRE for geographic atrophy, is seen in its financial reports. According to ChartMill's basic analysis report, APLS receives a Growth Rating of 7 out of 10, drawing attention to its path.
- Strong Sales Expansion: The firm has shown notable top-line growth, with sales increasing by 127.23% on a yearly basis over recent periods. In the most recent year, sales grew by 42.11%.
- Profit Progress: Possibly more important for a developing biotech, APLS shifted toward profit. Earnings Per Share (EPS) rose by 116.40% in the past year, changing from negative to positive.
- Coming Projections: Experts forecast this progress to persist, with an estimated average yearly EPS growth of 25.32% and sales growth of 12.82% in future periods.
This expansion is backed by a business focused on large markets with significant unmet needs, an important qualitative element for lasting growth. While the firm's financial condition and profit ratings are moderate (both at 5/10), the price is not high compared to its industry group, making the solid growth picture prominent as the main investment idea.
The Chart Arrangement
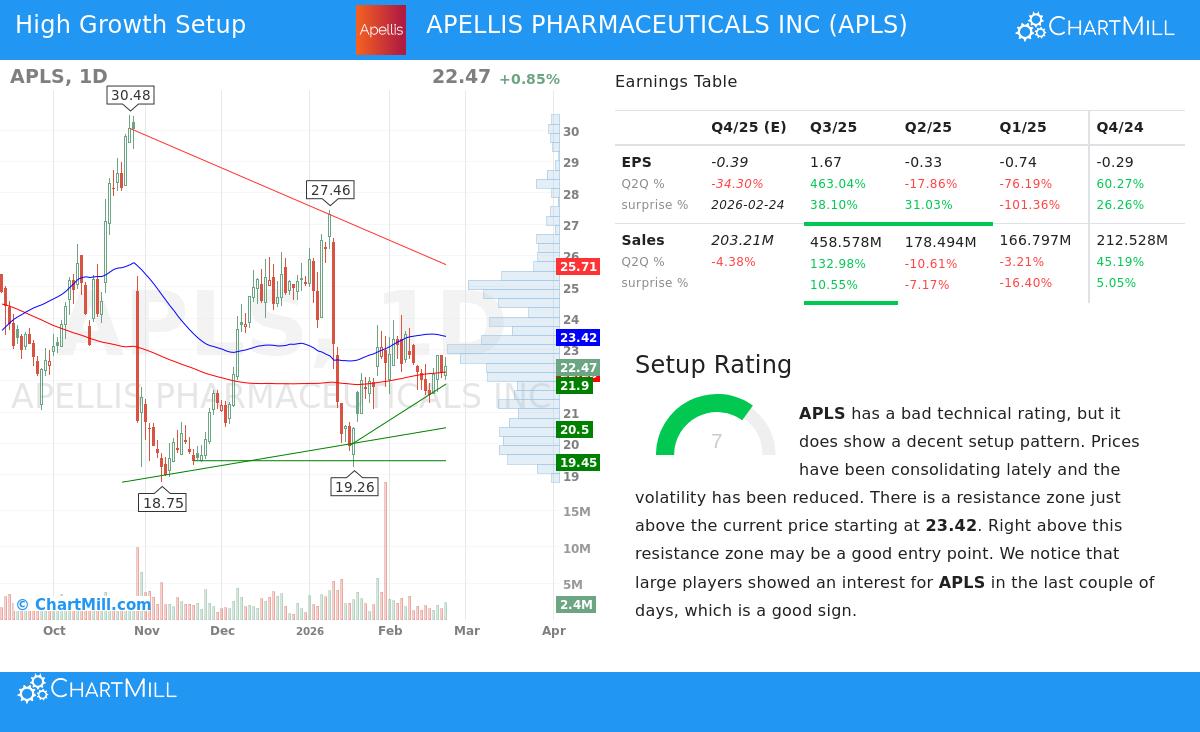
While basics give the "reason," chart study helps spot the "timing." A solid growth narrative can stall if the market is not yet in agreement; a positive chart arrangement can indicate that agreement may be starting. APLS presently shows a Technical Rating of only 1/10, meaning weak recent results compared to the market. However, its Setup Rating is a more hopeful 7/10, suggesting the share is creating a shape that might come before a shift.
The chart analysis report states that APLS has been changing hands in a resting range between about $21.10 and $24.10 over the last month, with price swings lessening. This type of price activity often happens before a clear advance.
- Important Barrier: A clear barrier zone sits just above the present price, extending from $23.42 to $23.49. This zone is created by a mix of trend lines and average prices.
- The Arrangement Idea: The method suggests that a clear move above this barrier zone on good trading volume could signal the finish of the resting phase and the start of a new upward direction, possibly benefiting from the core growth basics.
- Market Setting: It is important to state that while the S&P 500 shows a positive near-term direction, APLS has fallen behind, trading in the middle of its 52-week span. An advance could show the share catching up to the wider market's positive movement.
Why the Pairing is Important
The filter reasoning is intentional: a solid growth picture without a helpful chart could mean waiting without limit for market acceptance. On the other hand, a positive chart shape in a firm with weak basics can be a speculative "hollow" advance. By pairing the two, the method looks for firms where basic momentum could be the driver that powers a chart advance, or where a chart advance might be the initial signal of the market re-valuing the share to match its improving basics.
In the situation of APLS, the firm's shown and forecasted growth gives a substantial reason for the share to gain buyer interest. The seen resting period and nearness to barrier give a specific, visible level that, if passed, could start more chart-based buying and focus attention on the basic narrative.
Locating Comparable Chances
The example of Apellis Pharmaceuticals shows the possibility of a paired basic and chart filter method. For investors wanting to use this process to find other options, the ready-made "Solid Growth Shares with positive Technical Setup Ratings" filter is ready for more study.
You can examine the filter and its present outcomes here.
Disclaimer: This article is for information and learning only and does not form investment guidance, a suggestion, or a deal or request to buy or sell any investments. The study shown is based on information and reports from ChartMill.com and should not be the only foundation for any investment choice. Investing in shares, especially in biopharmaceutical firms like Apellis, includes large risk, including the possible loss of original investment. You should do your own complete study and talk with a registered financial consultant before making any investment choices.