
For technical investors looking to find stocks ready for their next rise, a common method involves searching for two main traits: solid existing momentum and a favorable price formation. The aim is to locate leading stocks that are not only moving up but are also holding their gains in a narrow band, preparing for a possible upward move. This method can be organized by using specialized measures like the ChartMill Technical Rating, which evaluates a stock's general trend condition, and the ChartMill Setup Quality Rating, which judges the condition of its present consolidation formation. Stocks that rate well on both measures are frequently top prospects for breakout formations.
A recent search for these technical breakout chances has identified APi Group Corp (NYSE:APG), a company offering life safety and specialty services. The stock currently shows a notable technical picture, receiving a full score for trend strength and a good score for its setup formation, indicating it may deserve additional attention from traders focused on momentum and price behavior.
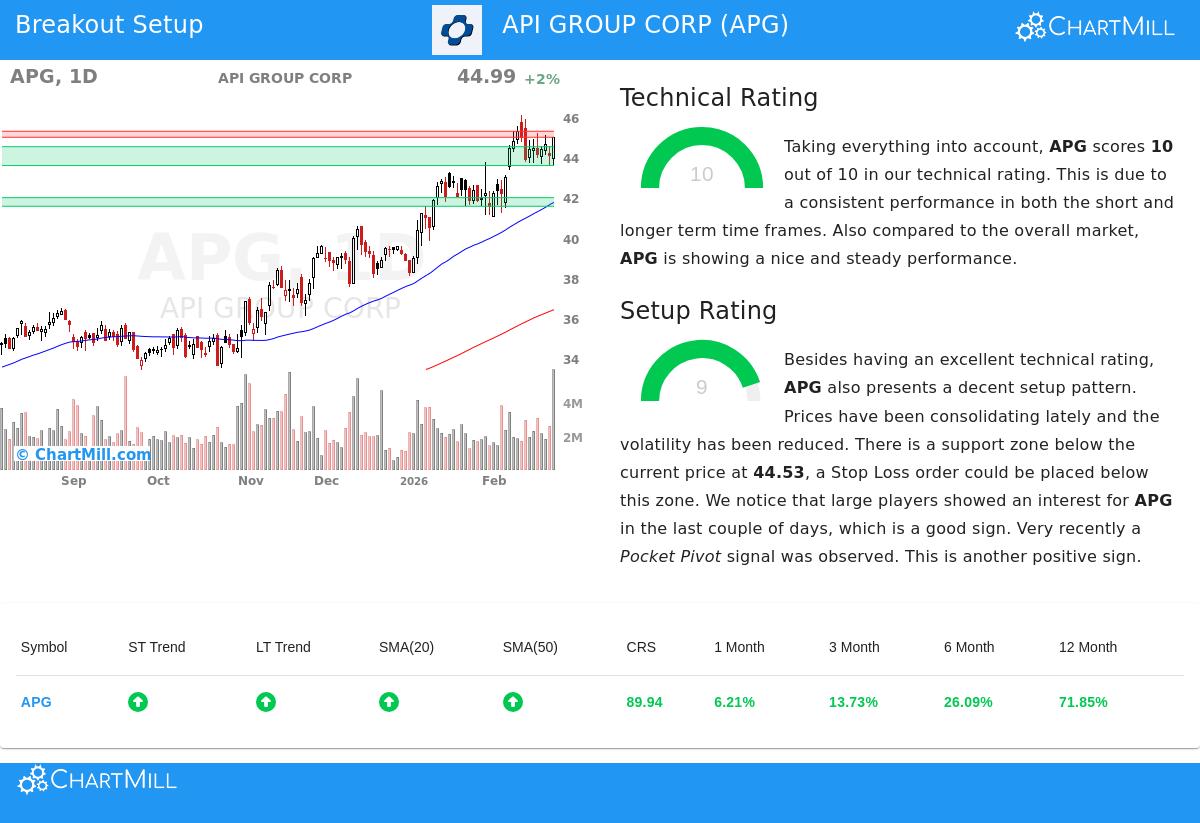
Technical Strength: A Base of Momentum
The main screen in a breakout method is finding stocks with solid and continuing upward momentum. A high ChartMill Technical Rating verifies that a stock is not just in a brief rise but is showing strength over several periods and measures. APG does very well in this basic area, having a top-level Technical Rating of 10 out of 10.
Looking at the full technical report shows the extent of this strength. The examination highlights several important positive elements that add to this high rating:
- Trend Agreement: Both the long-period and short-period trends for APG are rated as good. This agreement across periods is a typical indicator of a sound, confirmed uptrend.
- Price Action: The stock is trading close to its 52-week high and has shown better action, doing better than 89% of all stocks over the last year. Its steady pattern of increasing prices supports the positive story.
- Moving Average Backing: APG's price is trading above all its main simple moving averages (20, 50, 100, and 200-day), and each of these averages is itself in an upward arrangement. This forms a tiered support structure below the present price.
- Market Performance: While the S&P 500 is also near highs, APG's action matches the wider market's positive short-period trend, showing it is joining the advance rather than falling behind.
This mix of elements forms a solid technical foundation. For a breakout method, this is important because it raises the chance that a move above resistance will continue and not be quickly undone. A stock breaking out from a place of existing weakness is much more prone to fall short.
Setup Quality: The Pause Before the Action
While solid momentum is necessary, buying a stock after a large rise can be dangerous. The second important screen is the Setup Quality Rating, which finds stocks that are pausing their recent gains in a narrow range, gathering energy for the next possible rise. APG gets a 9 out of 10 on this measure, signaling a very good setup formation.
The technical report explains why the setup is viewed as high-quality:
- Lower Volatility & Pause: The report mentions "lower volatility while prices have been pausing in the latest period." This time of rest after a strong move lets the stock ease overbought conditions and forms a clear support level.
- Clear Support Area: A notable support area is found between $43.59 and $44.53, made from a mix of trendlines and moving averages. A well-marked support zone allows for sensible placement of a stop-loss order, which is a key part of risk control.
- Large Trader Activity: The examination found positive action from big participants (measured by the Effective Volume indicator) in recent days, along with a recent "Pocket Pivot" signal—a positive price/volume accumulation formation. This can be seen as experienced traders showing interest during the pause phase.
From this examination, an example trading setup is created. It proposes a possible entry point just above the nearby resistance at $45.31, with a protective stop-loss order placed below the support area at $43.58. This would cap the theoretical risk on the trade to about 3.8%.
A Prospect for the Watchlist
APi Group Corp shows a standard example for technical breakout scanning. Its full Technical Rating of 10 confirms it is a market leader with strong existing momentum. Its Setup Rating of 9 shows it has used recent weeks absorbing those gains in a positive way, with clear support and indicators of accumulation. Combined, these ratings indicate APG is building a foundation from which it could try its next notable upward move.
Find Other Possible Breakouts The market always offers new chances. The Technical Breakout Setups scan is refreshed each day to screen for stocks showing similarly solid technical and setup ratings. You can see the present list of prospects by going to the Technical Breakout Setups page.
,
Disclaimer: This article is for information only and is not investment advice, a suggestion, or an offer or request to buy or sell any securities. The examination uses technical measures and past data, which are not assurances of future results. All trading and investment choices include risk, including the chance of losing the original investment. Readers should do their own investigation and talk with a qualified financial advisor before making any investment choices. The example trade setup mentioned is created automatically for illustration and should not be seen as a specific suggestion.