
For investors who use charts and price action to guide their choices, a methodical way to find possible trades is important. One technique involves looking for stocks that are both technically sound and building a constructive price pattern, a pairing that can point to a coming price move. This method centers on two specific metrics: the ChartMill Technical Rating, which judges the general condition and direction of a stock, and the ChartMill Setup Quality Rating, which judges the condition of its present consolidation pattern. A strong Technical Rating implies a stock is in a confirmed upward trend, while a strong Setup Rating shows it is moving in a tight range, possibly preparing for its next upward move. AMETEK INC (NYSE:AME) recently appeared from such a search, displaying a profile that technical investors may find interesting.
Technical Health: A Firm Base
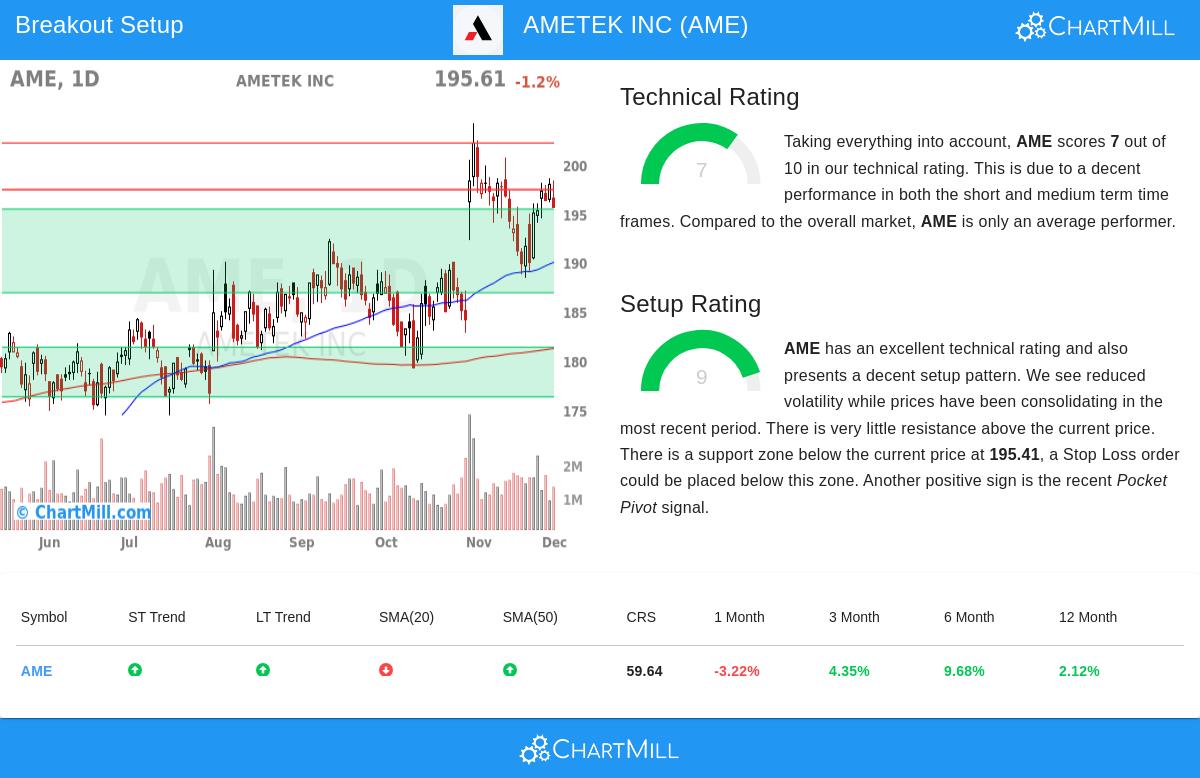
The first part of this breakout method is finding stocks with sound underlying technicals. AMETEK’s ChartMill Technical Rating of 7 out of 10 puts it clearly in positive ground, showing a healthy upward trend. This score is not given casually; it combines multiple timeframes and technical elements. The report states that both the long-term and short-term trends for AME are positive, a bullish alignment that gives a good setting for any possible price change.
Important technical notes backing this rating include:
- The stock is priced above its important moving averages (50-day, 100-day, and 200-day), which are all pointing up.
- It is priced in the upper part of its 52-week range, showing relative strength over the last year.
- While its one-year performance is close to the wider market, its medium- and short-term price action remains constructive.
This base strength is important for the method because it looks for breakouts in stocks that are already in clear upward trends, not trying to catch a declining stock. A stock with a strong Technical Rating is more probable to see a good breakout and keep its advances.
Setup Quality: The Tightening Before the Move
While technical strength is needed, it is not enough for a well-timed entry. A stock can be in a strong upward trend but be overstretched, offering a poor balance of risk and reward. This is where the Setup Quality Rating becomes key. AME does very well here with a top rating of 9 out of 10, indicating a very good consolidation pattern.
The technical report explains why this setup is highly scored:
- Lower Volatility & Consolidation: Over the last month, AME has been trading in a set range between about $188.47 and $202.43. It is currently consolidating in the middle of this range, which often comes before a directional price change.
- Clear Support and Resistance: The analysis finds an important support area between $186.90 and $195.41, made by a combination of moving averages and trendlines. Just above the present price, resistance is seen around $197.38. This makes a clear structure for trade planning.
- Positive Signals: A recent "Pocket Pivot" signal—a price increase on higher-than-normal volume—hints at accumulation, adding a positive detail to the setup.
This high-condition consolidation directly answers the "when to buy" question of the method. It shows the stock is pausing and gathering momentum near the highs of its recent range, with clear levels that allow for exact entry and stop-loss placement.
A Possible Trading Plan
From this analysis, the automated report proposes a specific, though example-only, trading plan. The reasoning follows the breakout method: enter on a move above the nearby resistance, confirming the breakout is starting, and place a protective stop below the recent consolidation support.
- Suggested Entry: A buy stop order at $197.39, just above the $197.38 resistance level.
- Suggested Stop Loss: A stop order at $188.46, placed below the found support area.
- Risk Details: This sets a risk of about $8.93 per share, or 4.5% of the entry price.
It is important to note that this is an example plan created from the technical levels. Investors should always do their own study, change details to fit their personal risk comfort, and know about fundamental factors like coming earnings reports.
Finding Like Opportunities
AMETEK shows the kind of opportunity the Technical Breakout screen is made to find each day—stocks with solid trends ready for their next price change. The screen sorts the market for other stocks showing a similar pairing of strong Technical and Setup Ratings.
For investors wanting to see the present list of possible breakout candidates, the screen is refreshed often and can be found here: View Today's Technical Breakout Setups.
Disclaimer: This article is for information only and does not make up investment advice, a suggestion, or an offer to buy or sell any security. The trading plan described is an automated, illustrative example and should not be seen as a specific suggestion. All investing and trading includes risk, including the possible loss of principal. Investors should do their own study and talk with a qualified financial advisor before making any investment choices. Past results are not a guide for future results.