
For investors aiming to profit from momentum, a plan that joins solid core business expansion with a positive chart formation can be an attractive method. This process tries to find firms that are not only increasing their earnings and sales at a better-than-normal rate but are also seeing a rise in investor interest, shown by their share price moving out of a period of sideways movement. The objective is to locate shares where basic health and good market feeling come together, possibly marking the start of a continued rise. ANALOG DEVICES INC (NASDAQ:ADI) appears from such a search, offering a situation where healthy growth numbers meet a positive technical arrangement.
A Base of Healthy Expansion
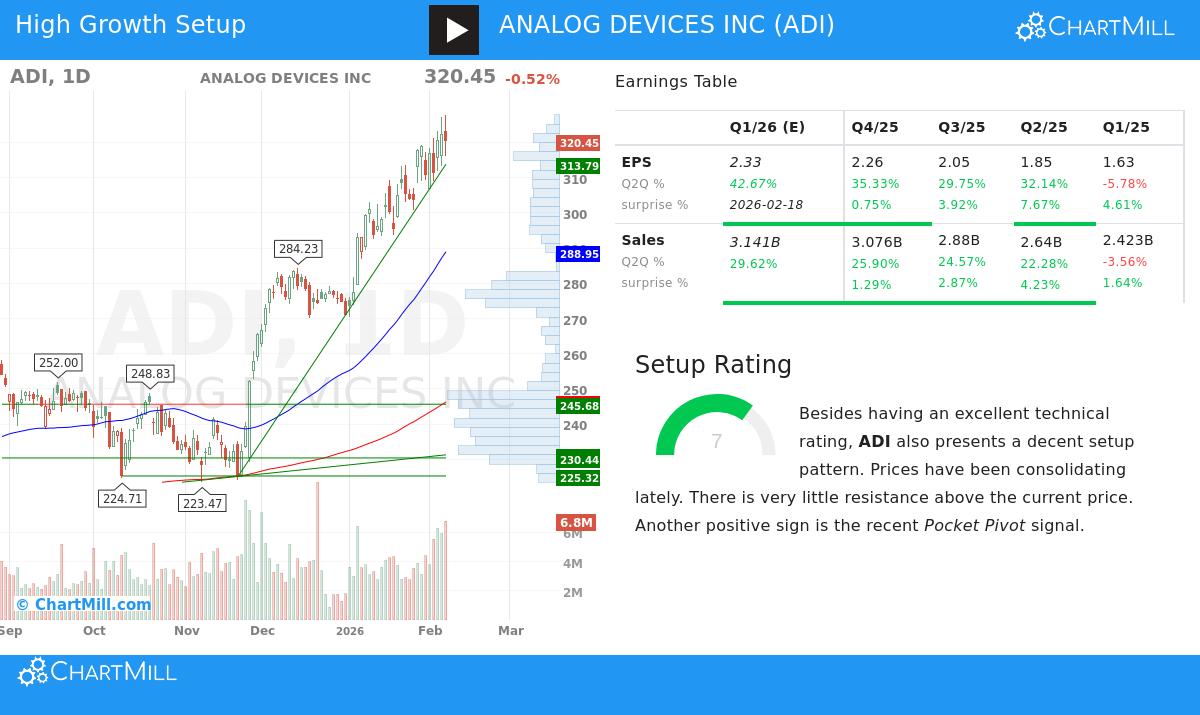
Fundamentally, the growth investment view looks for businesses that are growing quicker than their competitors and the overall market. Analog Devices displays this trait plainly. The firm's basic report indicates notable growth, with sales increasing 16.89% over the last year and Earnings Per Share (EPS) rising by 22.10%. This is not an isolated occurrence; the firm has kept an average yearly sales growth of 14.49% and EPS growth of 9.67% over recent years.
In the future, experts believe this pace will persist, with estimated yearly EPS growth of almost 17% and sales growth of 11.46%. This expected growth is a vital part of the search process, as it implies the firm's growth story stays in place. Also, the firm's earnings are firm, with sector-top margins:
- Gross Margin: 61.47%, doing better than 86% of semiconductor sector companies.
- Operating Margin: 27.25%, also superior to 86% of the sector.
- Profit Margin: A sound 20.58%.
This pairing of fast growth and high earnings is a sign of a good growth business, as it shows the operation can grow effectively while turning revenue into profit. You can examine all the information in the fundamental analysis report for ADI.
Technical Pace Supporting the Narrative
While sound basics give the "reason," chart study can help pinpoint the "timing" by measuring market feeling. Analog Devices' chart view is distinctly positive. The share is in a clear upward pattern, with both its near-term and long-term trends scored as good. It lately reached a new 52-week peak, a traditional indicator of health, though it is important to see this action matches the wider market's results.
The share has been moving sideways within a band between about $292 and $328 over the last month and is now priced close to the upper end of that band. This period of sideways movement above climbing average prices (like the 50-day and 200-day) frequently serves as a rest before a possible resumption of the pattern. The chart study points to minimal price barriers above, which might permit more gains if the share clearly moves past its recent high.
A particular sign noted in the report is a recent "Pocket Pivot," which is a price and volume formation indicating buying interest, where the share advances on volume greater than the highest declining volume observed in the previous 10 days. This can be a signal of professional buyer activity, giving more support to the chance of an upward move. For a picture of these chart elements, view the technical analysis report for ADI.
Price and Points to Think About
No review is whole without looking at cost. Analog Devices sells at a Price-to-Earnings (P/E) ratio over 40, which seems high by itself. Yet, setting is important. This price is actually lower than about 69% of its semiconductor sector competitors and is backed by the firm's strong earnings and anticipated profit growth. The PEG ratio, which includes that growth, implies the price could be more fair. Investors must balance the higher cost with the firm's steady performance and top market standing in analog and mixed-signal semiconductors.
A Joined Viewpoint
The search process that found Analog Devices tries to reduce danger by needing both basic soundness and chart pace. The firm's healthy growth and earnings scores meet the basic needs, showing a sound and growing operation. At the same time, its good pattern, sideways movement near peaks, and supporting volume formations satisfy the chart needs for a possible upward move. This combination indicates the market is starting to acknowledge and value the firm's basic qualities.
For investors wanting to look into other shares that fit this mix of healthy growth and positive chart formations, more outcomes are available using the Strong Growth Stock Technical Setups screen.
,
Disclaimer: This article is for information only and is not financial guidance, an endorsement, or a solicitation to buy or sell any investment. Investing carries risk, including the chance of losing the original amount invested. Always do your own investigation and think about your personal money situation and risk comfort before making any investment choices.