
For investors who use charts and price action to guide their choices, a methodical way to find opportunities is important. One method looks for stocks that are both technically sound and making a constructive price pattern, a pairing that can point to a possible breakout. This approach uses two specific metrics: the ChartMill Technical Rating, which reviews the general condition and trend of a stock, and the ChartMill Setup Quality Rating, which checks if the stock is consolidating in a manner that gives a clear, low-risk entry point. By selecting for stocks with good marks in both areas, traders try to find interesting setups inside the market's top companies.
Arch Capital Group Ltd. (NASDAQ:ACGL), a company offering specialty insurance and reinsurance, now shows a profile that fits this breakout screening method. An examination of its technical report shows marks that put it on the watchlist for technical investors looking for prepared momentum opportunities.
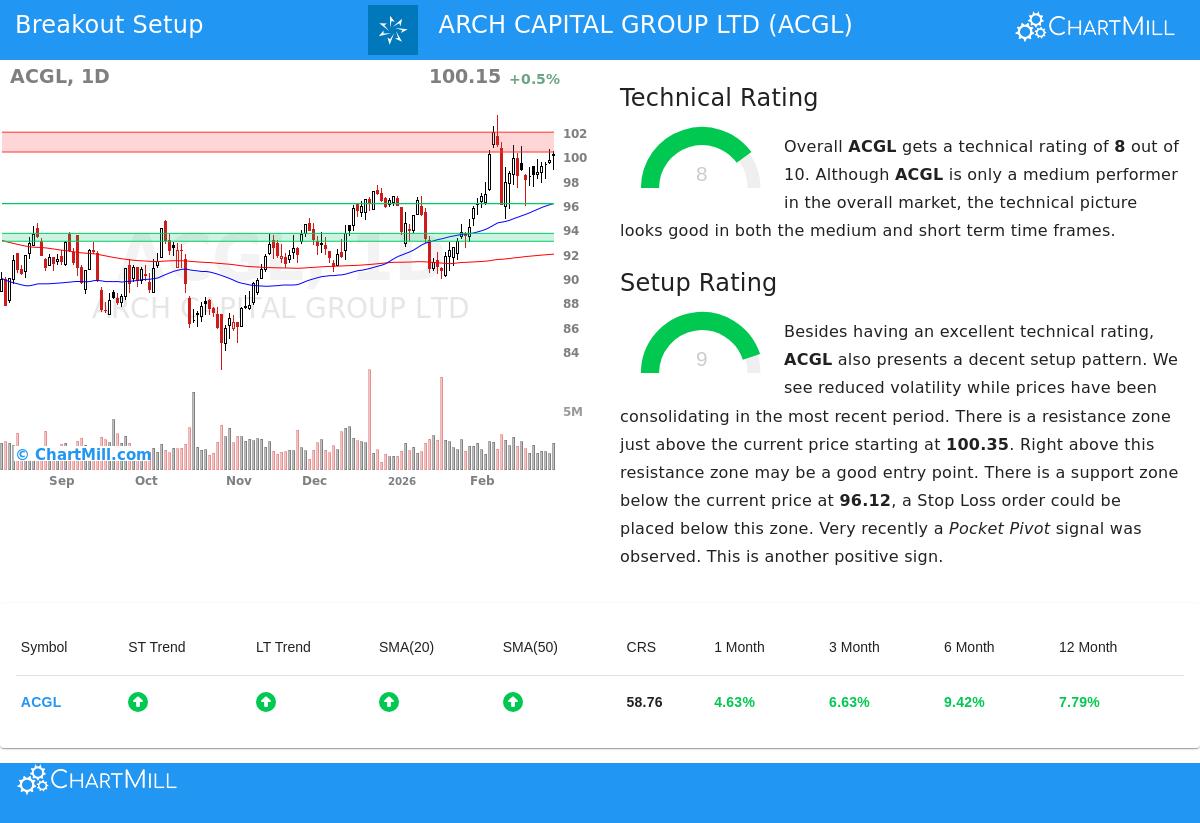
Technical Strength: A Firm Base
The first part of the breakout plan is finding stocks with sound underlying technicals, as a solid trend gives support to a breakout. Arch Capital Group gets a Technical Rating of 8 out of 10, pointing to a technically fit stock set for long setups. This mark is backed by a few main points:
- Positive Trend Agreement: Both the long-term and short-term trends for ACGL are marked as positive. This agreement across periods indicates continued buying pressure and lessens the chance of opposing trend moves.
- Sound Industry Position: In the competitive insurance field, ACGL does better than 81% of its 150 peers. This relative performance is an important sign, showing the stock is a frontrunner in its group instead of just moving with a wider market rise.
- Supportive Moving Averages: The stock's price is above its important moving averages (20, 50, 100, and 200-day), and all these averages are in a rising arrangement. This ordered, upward shape is a typical sign of a good uptrend.
This mix of a clear uptrend, group leadership, and positive moving average agreement meets the "which stock" part of the plan. It verifies ACGL is not a weak performer but a strong one, giving a firm base for a possible continued move.
Setup Quality: The Pattern for a Possible Breakout
A solid trend by itself is not a sign to buy; entering at a bad moment can lead to quick losses. This is where the Setup Quality Rating, which gives a high 9 for ACGL, becomes important. It answers the "when to buy" question by finding consolidation patterns that frequently come before a new move upward.
The analysis states that ACGL has been trading in a band between about $94.84 and $103.39 over the last month and is now consolidating in the middle of this band. This price tightening has lowered volatility and made a set structure with clear support and resistance points.
- Resistance Area: A clear resistance area is seen between $100.35 and $101.98. A clear move above this area could signal the finish of consolidation and the start of a new breakout stage.
- Support Area: A firm support area exists between $96.10 and $96.12, made by a meeting of trendlines and moving averages. This gives a sensible and close point for setting a protective stop-loss order, clearly setting the trade's risk.
- Supporting Sign: The report also mentions a recent "Pocket Pivot" sign, a volume-based pattern that hints at accumulation by bigger players, adding more weight to the constructive setup.
This high Setup Rating shows that ACGL is not stretched but is instead tightening inside a band, offering a possible entry point with a well-set risk limit just below support.
A Specific Trading Plan
From this technical and setup review, a sample trading plan is made. It proposes an entry point just above the resistance area at $101.99, with a stop-loss order set below the support area at $96.09. This caps the example worst-case risk on the trade to about 5.8%. For a trader controlling a 1% total portfolio risk, this means a position size of about 17.3% of capital. It is important to know this is an example made from the closest support and resistance points. Traders must always change such details to match their own risk comfort and verify the setup fits their wider market opinion.
Finding Like Opportunities
Arch Capital Group shows the kind of opportunity a orderly technical screen aims to find: a group frontrunner in a steady uptrend, pausing in a close band. For investors wanting to see a new list of such possible breakout setups each day, the Technical Breakout Setups screen methodically sorts the market for stocks with high Technical and Setup Ratings.
Disclaimer: This article is for information only and is not investment advice, a suggestion, or an offer to buy or sell any security. The trading plan shown is an automatic, example for learning. All investing and trading has risk, including the possible loss of principal. Always do your own complete research, think about your personal money situation and risk comfort, and talk with a qualified financial advisor before making any investment choices. Past results do not guarantee future outcomes.