
Our stock screener has identified ARCH CAPITAL GROUP LTD (NASDAQ:ACGL) as a potential breakout candidate. This technical breakout setup pattern occurs when the stock consolidates after a strong uptrend. While the actual breakout is uncertain, it may be worth keeping an eye on NASDAQ:ACGL.
Technical analysis of NASDAQ:ACGL
ChartMill assigns a proprietary Technical Rating to each stock. The score is computed daily by evaluating various technical indicators and properties. The score ranges from 0 to 10.
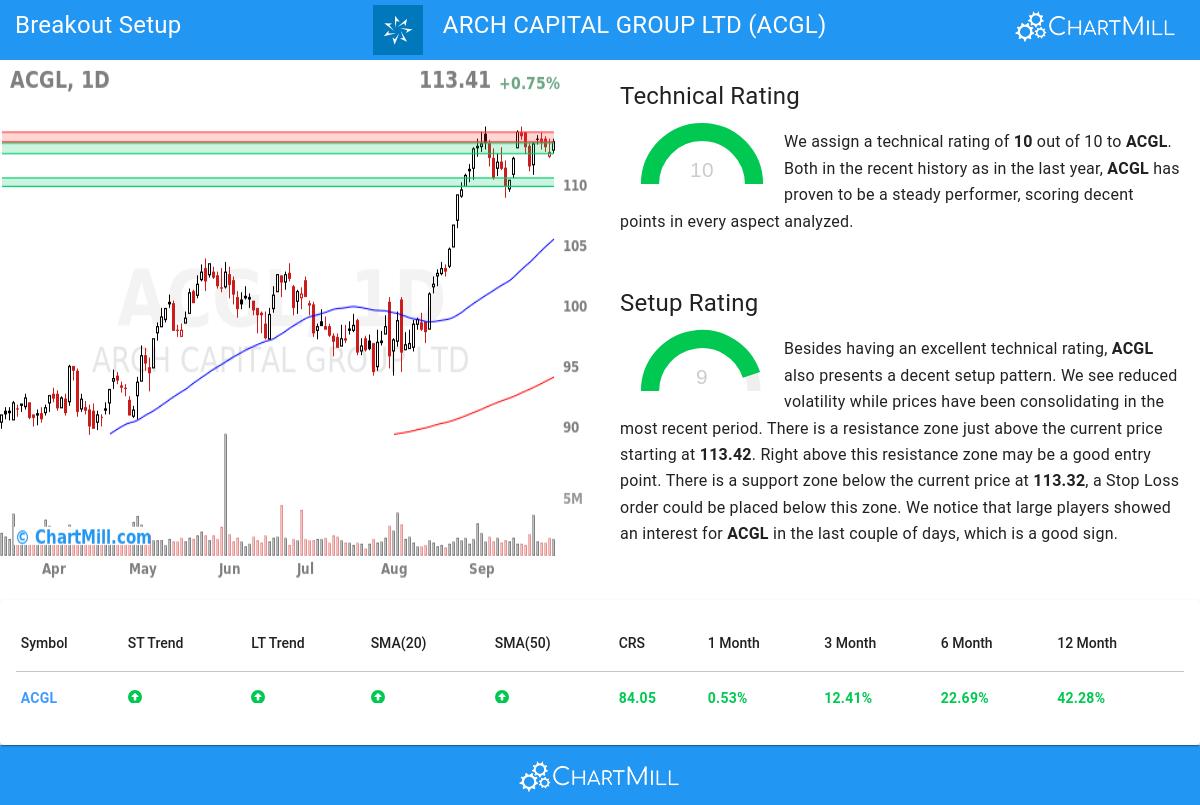
Overall ACGL gets a technical rating of 10 out of 10. Both in the recent history as in the last year, ACGL has proven to be a steady performer, scoring decent points in every aspect analyzed.
- The long and short term trends are both positive. This is looking good!
- When comparing the yearly performance of all stocks, we notice that ACGL is one of the better performing stocks in the market, outperforming 84% of all stocks. On top of that, ACGL also shows a nice and consistent pattern of rising prices.
- ACGL is one of the better performing stocks in the Insurance industry, it outperforms 75% of 140 stocks in the same industry.
- ACGL is currently trading near its 52 week high, which is a good sign. The S&P500 Index however is also trading near new highs, which makes the performance in line with the market.
- ACGL is currently showing a bull flag pattern! A bull flag pattern occurs when prices pull back slightly after a strong rise up. This may be a nice opportunity for an entry.
- In the last month ACGL has a been trading in a tight range between 108.77 and 114.69.
Check the latest full technical report of ACGL for a complete technical analysis.
Why is NASDAQ:ACGL a setup?
Besides the Technical Rating, ChartMill also assign a Setup Rating to every stock. This setup score also ranges from 0 to 10 and determines to which extend the stock is consolidating. This is achieved by evaluating multiple short term technical indicators. NASDAQ:ACGL currently has a 9 as setup rating:
ACGL has an excellent technical rating and also presents a decent setup pattern. We see reduced volatility while prices have been consolidating in the most recent period. There is a resistance zone just above the current price starting at 113.42. Right above this resistance zone may be a good entry point. There is a support zone below the current price at 113.32, a Stop Loss order could be placed below this zone. We notice that large players showed an interest for ACGL in the last couple of days, which is a good sign.
Trading setups like NASDAQ:ACGL
One way to play this would be to wait for the actual breakout to happen and buy when the stock breaks out above the current consolidation zone. A possible place for a stop loss would be below this zone.
Disclaimer: This article is not intended to provide trading advice. It is crucial to conduct your own analysis and consider your own observations and trading style when making investment decisions. The article solely presents technical observations and should not be relied upon as a sole basis for trading.
Our Breakout screener lists more breakout setups and is updated daily.
Disclaimer
This article should in no way be interpreted as advice. The article is based on the observed metrics at the time of writing, but you should always make your own analysis and trade or invest at your own responsibility.