Exploring NYSE:LLY's high growth characteristics.
By Mill Chart
Last update: Oct 17, 2024
Our stock screener has flagged ELI LILLY & CO (NYSE:LLY) as a potential breakout candidate. This occurs when the stock shows signs of consolidation after a notable upward trend. While we can't predict the actual breakout, it's worth monitoring NYSE:LLY for potential movement.
In-Depth Technical Analysis of NYSE:LLY
ChartMill assigns a proprietary Technical Rating to each stock. The score is computed daily by evaluating various technical indicators and properties. The score ranges from 0 to 10.
Taking everything into account, LLY scores 9 out of 10 in our technical rating. Both in the recent history as in the last year, LLY has proven to be a steady performer, scoring decent points in every aspect analyzed.
- The short term is neutral, but the long term trend is still positive. Not much to worry about for now.
- Looking at the yearly performance, LLY did better than 84% of all other stocks. On top of that, LLY also shows a nice and consistent pattern of rising prices.
- LLY is one of the better performing stocks in the Pharmaceuticals industry, it outperforms 74% of 196 stocks in the same industry.
- LLY is currently trading in the upper part of its 52 week range. The S&P500 Index however is currently trading near a new high, so LLY is lagging the market slightly.
- In the last month LLY has a been trading in the 858.81 - 939.86 range, which is quite wide. It is currently trading in the middle of this range where prices have been consolidating recently, this may present a good entry opportunity, but some resistance may be present above.
Our latest full technical report of LLY contains the most current technical analsysis.
Why is NYSE:LLY a setup?
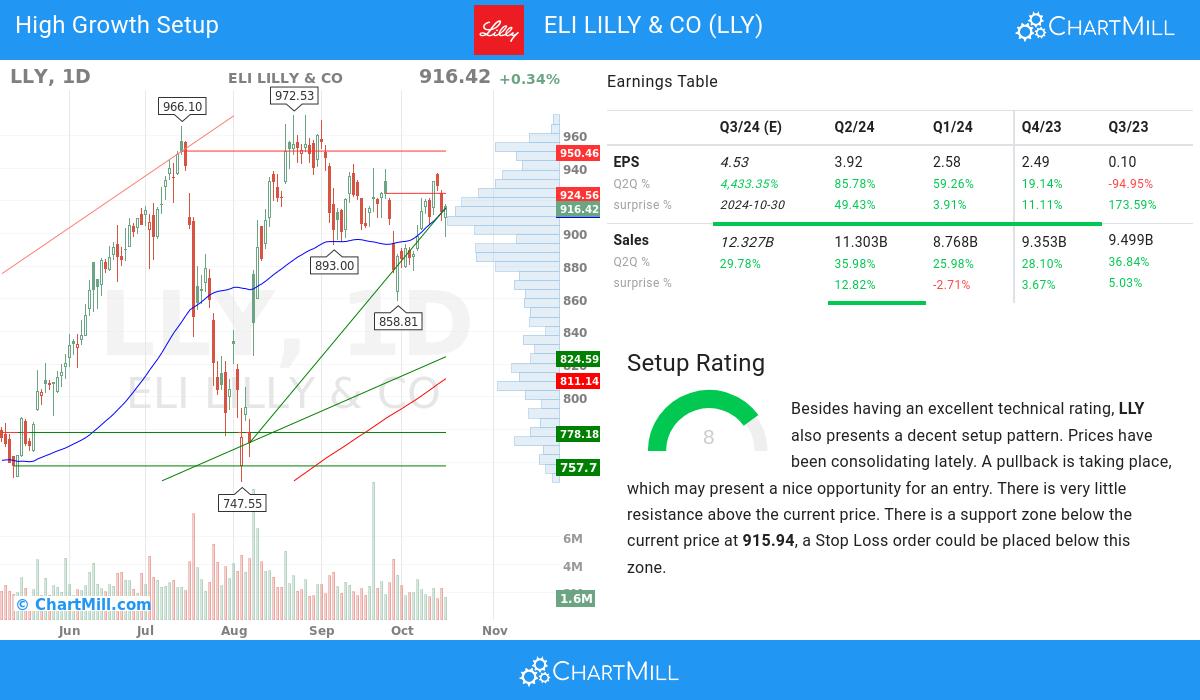
In addition to the Technical Rating, ChartMill provides a Setup Rating for each stock. This rating, ranging from 0 to 10, assesses the level of consolidation in the stock based on multiple short-term technical indicators. Currently, NYSE:LLY has a 8 as its setup rating, indicating its current consolidation status.
Besides having an excellent technical rating, LLY also presents a decent setup pattern. Prices have been consolidating lately. A pullback is taking place, which may present a nice opportunity for an entry. There is very little resistance above the current price. There is a support zone below the current price at 915.94, a Stop Loss order could be placed below this zone.
What matters for high growth investors.
- The earnings per share (EPS) of ELI LILLY & CO have shown positive growth on a quarter-to-quarter (Q2Q) basis, with a 85.78% increase. This reflects the company's ability to improve its profitability over time.
- The quarter-to-quarter (Q2Q) revenue growth of 35.98% of ELI LILLY & CO has been strong, reflecting the company's ability to generate consistent sales growth. This growth suggests the company's ability to meet customer needs and drive revenue growth.
- ELI LILLY & CO has achieved significant 1-year revenue growth of 31.87%, signaling its ability to capture market opportunities and drive top-line expansion. This growth indicates the company's effective execution and its potential for continued success.
- ELI LILLY & CO has seen a 17.84% change in the average next Quarter EPS Estimate by analysts over the last 3 months, signaling the shifting perception of the company's EPS outlook.
- The quarterly earnings of ELI LILLY & CO have shown a 85.78% increase compared to the previous quarter, as revealed in the recent financial report. This growth signifies positive momentum in the company's financials, pointing towards a promising upward trend
- ELI LILLY & CO shows accelerating EPS growth: when comparing the current Q2Q growth of 85.78% to the previous year Q2Q growth of 68.8%, we see the growth rate improving.
- With a favorable trend in its operating margin over the past year, ELI LILLY & CO demonstrates its ability to enhance profitability through efficient operations. This growth reflects the company's focus on optimizing its cost structure.
- In terms of Return on Equity(ROE), ELI LILLY & CO is performing well, achieving a 54.14% ratio. This highlights the company's effective allocation of shareholder investments and signifies its commitment to maximizing returns.
- ELI LILLY & CO maintains a healthy Debt-to-Equity ratio of 1.75. This indicates the company's conservative capital structure and signifies its ability to effectively manage debt obligations while maintaining a strong equity position.
- The ownership composition of ELI LILLY & CO reflects a balanced investor ecosystem, with institutional shareholders owning 82.54%. This indicates a broader market participation and potential for increased trading liquidity.
- ELI LILLY & CO has a strong history of beating EPS estimates in the last 4 quarters, signaling its ability to consistently exceed market expectations. This indicates the company's strong financial performance and its potential for creating shareholder value.
- The Relative Strength (RS) of ELI LILLY & CO has consistently been strong, with a current 84.26 rating. This indicates the stock's ability to exhibit relative price outperformance and reflects its competitive strength. ELI LILLY & CO demonstrates promising potential for sustained price momentum.
More high growth momentum breakout stocks can be found in our High Growth Momentum Breakout screen.
Disclaimer
This article should in no way be interpreted as advice. The article is based on the observed metrics at the time of writing, but you should always make your own analysis and trade or invest at your own responsibility.
1038.4
+5.43 (+0.53%)
Find more stocks in the Stock Screener