
Investors aiming to benefit from the next group of high-performing equities frequently use a two-part method, combining the prospective focus of fundamental analysis with the timing clues offered by technical patterns. One particular tactic involves searching for solid growth stocks that are also displaying encouraging technical breakout formations. This technique tries to find companies with strong core business momentum, shown by increasing revenues and earnings, just as their stock prices start to move out of phases of sideways movement, possibly indicating the beginning of a new rising trend. It is the combination of an attractive growth narrative and a positive chart formation that can provide a tactical entry point.
Super Micro Computer Inc (NASDAQ:SMCI) appears from such a search, offering a situation where solid fundamental growth measurements meet a clear technical formation. The company, a top supplier of high-performance server and storage systems, is a key facilitator in data centers, cloud computing, and the growing artificial intelligence field. Its business approach, centered on efficient and frequently liquid-cooled rack-scale systems, places it squarely within several lasting technological macro trends.
Fundamental Growth Driver
The central argument for SMCI as a growth stock is strongly backed by its fundamental information. ChartMill’s fundamental analysis report gives the company a Growth Rating of 8 out of 10, a main component in the search method. This high mark is justified.
- Strong Historical Growth: Over the last few years, SMCI has shown notable top-line increase, with revenue increasing at an average yearly speed of 45.76%. Even on a yearly basis, revenue increase stays solid at almost 12%.
- Earnings Strength: While the latest year experienced a decrease in EPS, the longer-term pattern is impressive, with earnings per share increasing at an average of 50.41% each year over recent years.
- Solid Future Projection: Analysts forecast this momentum to persist, with anticipated yearly EPS increase of 12.24% and revenue increase averaging 21.77% in the next years. This prospective growth is necessary for maintaining a growth stock premium.
Beyond pure growth, the search also selects for acceptable profitability and financial condition, which SMCI meets with ratings of 7 and 6, in order. The company’s Return on Equity (12.15%) and Return on Assets (5.51%) exceed a large portion of its competitors in the Technology Hardware sector. Also, its balance sheet indicates strong liquidity, with a very high Current Ratio of 5.39. You can examine the complete details in the detailed fundamental analysis report for SMCI.
Technical Formation and Breakout Possibility
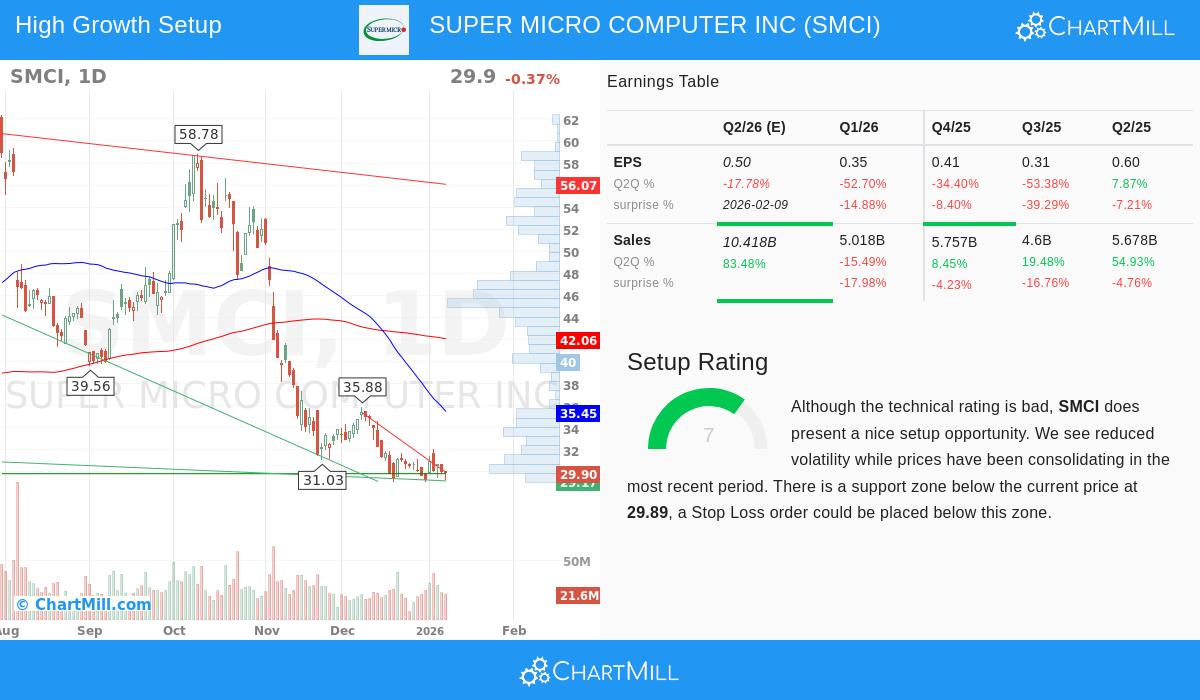
While the fundamentals establish the base for long-term possibility, the technical view supplies the setting for timing. According to ChartMill’s technical analysis, SMCI’s total rating is now low, showing its notable drop from 52-week highs and negative short- and long-term directions. However, the analysis importantly notes a Setup Rating of 7 out of 10.
This higher setup rating points out a positive formation appearing within the wider downward direction: a time of lower volatility and price sideways movement. The stock has been moving in a specific range, forming a base and letting some selling activity lessen. The technical report mentions the existence of a clear support area below the present price, near the $29.80-$29.90 level. In technical method, such sideways movement after a drop can create a "bear flag" formation, but it can also indicate a basing formation from which a turn can start if the fundamental story stays sound.
For a growth stock search method, this formation is important. It finds a point where a fundamentally solid company could be changing from a stage of price fall or inactivity into a possible new stage of accumulation or breakout. The search specifically looks for these technical formations in strongly increasing companies, suggesting that positive fundamental momentum might soon be seen in the price movement. The full technical view, including noted support and resistance levels, is present in the SMCI technical analysis report.
Valuation Setting
For growth investors, valuation is always a factor next to momentum. SMCI’s valuation measurements show a varied but mostly fair view compared to its growth outline. With a Price/Earnings ratio of 17.90, the stock trades below both the S&P 500 average (27.00) and a majority of its industry competitors. Its Price/Forward Earnings ratio of 9.42 seems especially appealing against wider market and industry averages. While its PEG ratio indicates the market is accounting for high growth forecasts, the company’s historical and projected growth speeds supply a fundamental reason for a premium.
A Combined Chance
The argument for SMCI within this specific investment method depends on the combination of its qualities. It has the fast revenue growth and firm profitability measurements that describe a solid fundamental growth narrative. At the same time, its chart displays the sort of technical sideways movement and specific risk levels (support areas) that searchers seek to find possible turning points. The method’s idea is that companies showing both characteristics could be set for a time where their solid business fundamentals start to push a positive re-evaluation in their stock price, breaking out from a technical base.
This mix of solid growth fundamentals and a clear technical formation is what specific searches are made to discover. If you are curious to examine other stocks that now match this "Strong Growth Stocks with Good Technical Setup" description, you can execute the search yourself using this pre-configured stock screener link.
Disclaimer: This article is for informational and educational purposes only and does not form investment advice, financial advice, or a suggestion to buy or sell any security. The analysis is based on data and reports supplied by ChartMill, and past performance is no assurance of future outcomes. Investing in stocks includes risk, including the possible loss of principal. Always perform your own complete research and think about talking with a qualified financial advisor before making any investment decisions.