
Why the high growth investor may take a look at NEWMONT CORP (NYSE:NEM).
By Mill Chart
Last update: Mar 28, 2025
NEWMONT CORP (NYSE:NEM) was identified as a Technical Breakout Setup Pattern by our stockscreener. Such a pattern occurs when we see a pause in a strong uptrend: after a strong rise the stock is consolidating a bit and at some point the trend may be continued. Whether this actually happens can not be predicted of course, but it may be a good idea to keep and eye on NYSE:NEM.
Insights from Technical Analysis
Every day ChartMill assigns a Technical Rating to every stock. The score ranges from 0 to 10 and is determined by evaluating multiple technical indicators and properties.
Overall NEM gets a technical rating of 10 out of 10. This is due to a consistent performance in both the short and longer term time frames. Also compared to the overall market, NEM is showing a nice and steady performance.
- Both the short term and long term trends are positive. This is a very positive sign.
- Looking at the yearly performance, NEM did better than 93% of all other stocks.
- NEM is part of the Metals & Mining industry. There are 151 other stocks in this industry. NEM outperforms 72% of them.
- In the last month NEM has a been trading in the 41.23 - 48.67 range, which is quite wide. It is currently trading near the high of this range.
- NEM is currently trading in the middle of its 52 week range. This is in line with the S&P500 Index, which is also trading in the middle of its range.
For an up to date full technical analysis you can check the technical report of NEM
How do we evaluate the setup for NEM?
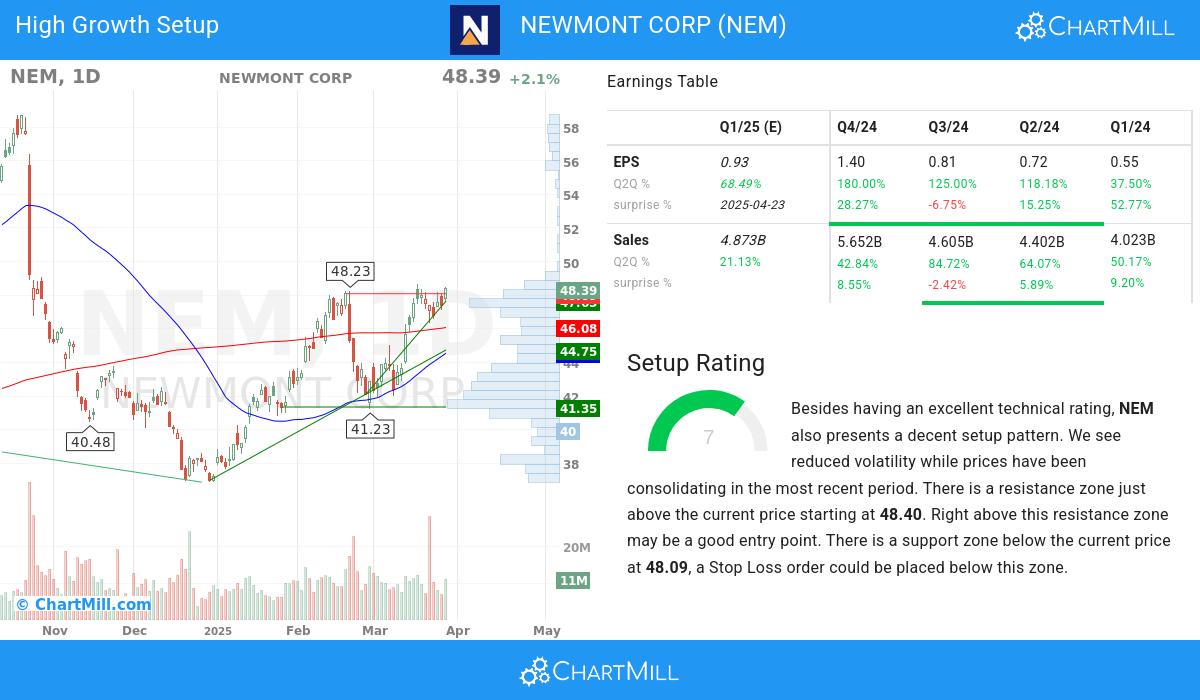
ChartMill takes into account not only the Technical Rating but also assigns a Setup Rating to each stock. This rating, on a scale of 0 to 10, reflects the degree of consolidation observed based on short-term technical indicators. Currently, NEM exhibits a 7 setup rating, indicating its consolidation status in recent days and weeks.
Besides having an excellent technical rating, NEM also presents a decent setup pattern. Prices have been consolidating lately and the volatility has been reduced. There is a resistance zone just above the current price starting at 48.40. Right above this resistance zone may be a good entry point. There is a support zone below the current price at 48.09, a Stop Loss order could be placed below this zone.
Assessing Growth for NEM
Every stock receives a High Growth Momentum Rating (HGM) from ChartMill, ranging from 0 to 10. This rating assesses various growth and profitability aspects, including historical and projected EPS and revenue growth. NEM boasts a 7 out of 10:
Earnings Momentum
- With a favorable trend in its quarter-to-quarter (Q2Q) earnings per share (EPS), NEM highlights its ability to generate increasing profitability, showcasing a 180.0% growth.
- The earnings per share (EPS) growth of NEM is accelerating: the current Q2Q growth of 180.0% is above the previous quarter Q2Q growth of 125.0%. Earnings momentum and acceleration are key for high growth systems.
- EPS acceleration happened 3 quarters in a row.
- Over the past year, NEM has demonstrated 119.0% growth in EPS, signifying its positive financial trajectory and potential for future profitability.
- NEM has experienced 42.84% q2q revenue growth, indicating a significant sales increase.
- NEM has demonstrated strong 1-year revenue growth of 58.16%, reflecting revenue momentum and its ability to generate consistent top-line expansion. This growth underscores the company's strong market position and its potential for future success.
- NEM has surpassed EPS estimates 3 times in the last 4 quarters, reflecting its strong financial performance and effective management. This trend suggests the company's ability to generate positive earnings surprises and drive shareholder value.
Profitability & Financial Strength
- The operating margin of NEM has seen steady growth over the past year, signaling improved profitability. This trend indicates the company's effective cost management and its ability to generate higher returns.
- With a favorable trend in its free cash flow (FCF) over the past year, NEM demonstrates its ability to generate robust cash flows and maintain financial stability. This growth reflects the company's focus on efficient capital allocation and cash management.
- NEM has a healthy Return on Equity(ROE) of 11.19%. This demonstrates the company's efficient utilization of capital and indicates its commitment to driving profitability.
- NEM's Debt/Equity ratio of 0.27 suggests a healthy balance between debt financing and shareholder equity.
Market Strength & Institutional Confidence
- NEM demonstrates a balanced ownership structure, with institutional shareholders at 73.84%. This indicates a diverse investor base, which can contribute to price stability and potential future growth.
- The Relative Strength (RS) of NEM has been consistently solid, with a current 93.88 rating. This highlights the stock's ability to exhibit sustained price strength and signifies its competitive advantage.
Our High Growth Momentum Breakout screen will find you more ideas suited for high growth momentum breakouts.
Disclaimer
This article should in no way be interpreted as advice. The article is based on the observed metrics at the time of writing, but you should always make your own analysis and trade or invest at your own responsibility.
114.12
-0.09 (-0.08%)
Find more stocks in the Stock Screener


