
Is NYSE:LLY a Fit for high Growth Investing Strategies?
By Mill Chart
Last update: Sep 26, 2024
A possible breakout setup was detected on ELI LILLY & CO (NYSE:LLY) by our stockscreener. A breakout pattern is formed when a stock consolidates after a strong rise up. We note that this pattern is detected purely based on technical analysis and whether the breakout actually materializes remains to be seen. It could be interesting to keep an eye on NYSE:LLY.
Zooming in on the technicals.
ChartMill employs a sophisticated system to assign a Technical Rating to every stock in its analysis. This rating, which ranges from 0 to 10, is determined by carefully assessing multiple technical indicators and properties.
We assign a technical rating of 8 out of 10 to LLY. In the last year, LLY was one of the better performers, but we do observe some doubts in the very recent evolution.
- The long and short term trends are both positive. This is looking good!
- When comparing the yearly performance of all stocks, we notice that LLY is one of the better performing stocks in the market, outperforming 89% of all stocks. We also observe that the gains produced by LLY over the past year are nicely spread over this period.
- LLY is part of the Pharmaceuticals industry. There are 195 other stocks in this industry. LLY outperforms 84% of them.
- LLY is currently trading near its 52 week high, which is a good sign. The S&P500 Index however is also trading near new highs, which makes the performance in line with the market.
- LLY is currently showing a bull flag pattern! A bull flag pattern occurs when prices pull back slightly after a strong rise up. This may be a nice opportunity for an entry.
Check the latest full technical report of LLY for a complete technical analysis.
Why is NYSE:LLY a setup?
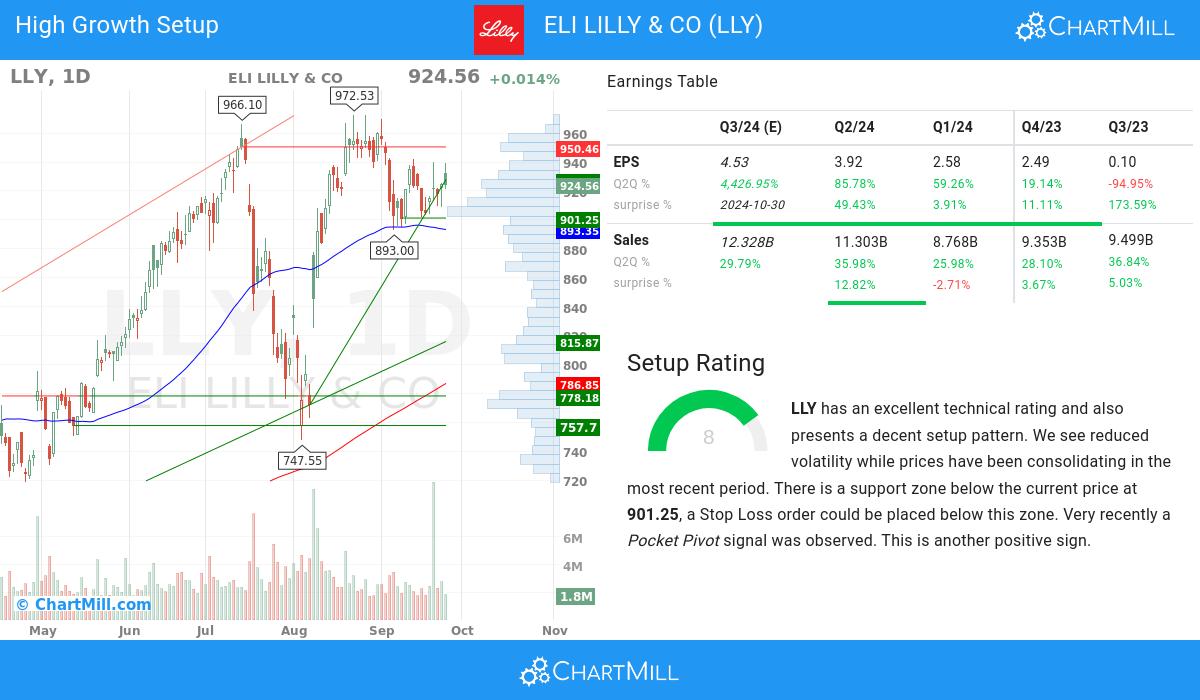
ChartMill incorporates a Setup Rating in its analysis, which measures the extent of consolidation in a stock over recent days and weeks. This rating, ranging from 0 to 10, is updated daily and takes into account multiple short-term technical indicators. The current setup rating for NYSE:LLY is 8:
Besides having an excellent technical rating, LLY also presents a decent setup pattern. Prices have been consolidating lately and the volatility has been reduced. There is a support zone below the current price at 901.25, a Stop Loss order could be placed below this zone. Another positive sign is the recent Pocket Pivot signal.
What matters for high growth investors.
- ELI LILLY & CO has shown positive momentum in its earnings per share (EPS) on a quarter-to-quarter (Q2Q) basis, with a 85.78% increase. This reflects the company's successful execution of its business strategies and its commitment to delivering improved financial results.
- The quarter-to-quarter (Q2Q) revenue growth of 35.98% of ELI LILLY & CO has been strong, reflecting the company's ability to generate consistent sales growth. This growth suggests the company's ability to meet customer needs and drive revenue growth.
- ELI LILLY & CO has achieved significant 1-year revenue growth of 31.87%, signaling its ability to capture market opportunities and drive top-line expansion. This growth indicates the company's effective execution and its potential for continued success.
- ELI LILLY & CO has seen a 17.72% change in the average next Quarter EPS Estimate by analysts over the last 3 months, signaling the shifting perception of the company's EPS outlook.
- The recent financial report of ELI LILLY & CO demonstrates a 85.78% increase in quarterly earnings compared to the previous quarter. This growth indicates positive momentum in the company's financials and suggests a promising upward trend
- The earnings per share (EPS) growth of ELI LILLY & CO are accelerating: the current Q2Q growth of 85.78% is above the previous year Q2Q growth of 68.8%. Earnings momentum and acceleration are key for high growth systems.
- With a favorable trend in its operating margin over the past year, ELI LILLY & CO demonstrates its ability to enhance profitability through efficient operations. This growth reflects the company's focus on optimizing its cost structure.
- The Return on Equity(ROE) of ELI LILLY & CO is 54.14%, which is a strong number. This indicates the company's ability to generate favorable returns for shareholders and reflects its effective management of resources.
- Maintaining a Debt-to-Equity ratio of 1.75, ELI LILLY & CO demonstrates a conservative financial approach. This signifies the company's focus on minimizing debt burdens while preserving a solid equity position.
- ELI LILLY & CO demonstrates a balanced ownership structure, with institutional shareholders at 82.52%. This indicates a diverse investor base, which can contribute to price stability and potential future growth.
- ELI LILLY & CO has consistently surpassed EPS estimates in the last 4 quarters, reflecting its strong financial performance and effective management. This trend suggests the company's ability to generate positive earnings surprises and drive shareholder value.
- The Relative Strength (RS) of ELI LILLY & CO has consistently been strong, with a current 89.96 rating. This indicates the stock's ability to exhibit relative price outperformance and reflects its competitive strength. ELI LILLY & CO demonstrates promising potential for sustained price momentum.
Our High Growth Momentum Breakout screen will find you more ideas suited for high growth momentum breakouts.
Disclaimer
This is not investing advice! The article highlights some of the observations at the time of writing, but you should always make your own analysis and invest based on your own insights.
NYSE:LLY (1/15/2026, 10:08:07 AM)
1029.33
-43.96 (-4.1%)
Find more stocks in the Stock Screener


