
A possible breakout setup was detected on COSTCO WHOLESALE CORP (NASDAQ:COST) by our stockscreener. A breakout pattern is formed when a stock consolidates after a strong rise up. We note that this pattern is detected purely based on technical analysis and whether the breakout actually materializes remains to be seen. It could be interesting to keep an eye on NASDAQ:COST.
Insights from Technical Analysis
As part of its analysis, ChartMill provides a comprehensive Technical Rating for each stock. This rating, ranging from 0 to 10, is updated on a daily basis and is based on the evaluation of various technical indicators and properties.
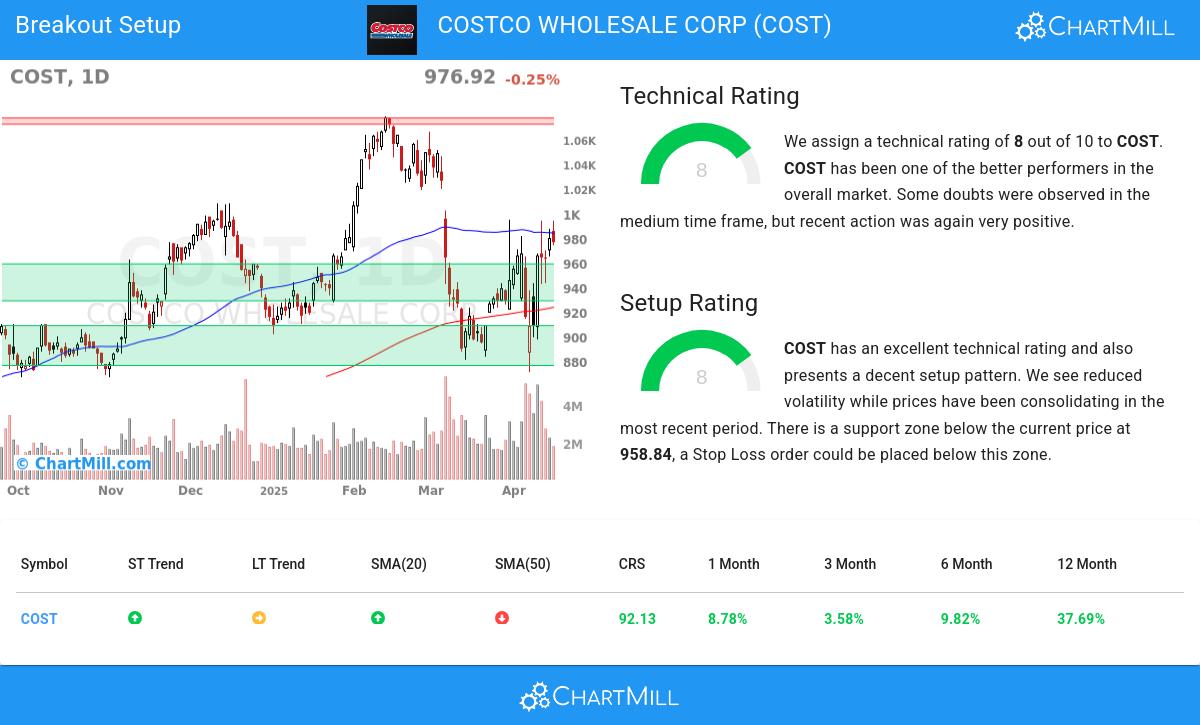
Overall COST gets a technical rating of 8 out of 10. In the last year, COST was one of the better performers in the market. There are positive signs in the very recent evolution, but the medium term picture is slightly mixed.
- The short term trend is positive, while the long term trend is neutral. So this is evolving in the right direction.
- Looking at the yearly performance, COST did better than 92% of all other stocks. On top of that, COST also shows a nice and consistent pattern of rising prices.
- COST is currently trading in the upper part of its 52 week range. The market is still in the middle of its 52 week range, so COST slightly outperforms the market at the moment.
- In the last month COST has a been trading in the 871.71 - 995.00 range, which is quite wide. It is currently trading near the high of this range.
- COST is an average performer in the Consumer Staples Distribution & Retail industry, it outperforms 66% of 40 stocks in the same industry.
Our latest full technical report of COST contains the most current technical analsysis.
How does the Setup look for COST
Besides the Technical Rating, ChartMill also assign a Setup Rating to every stock. This setup score also ranges from 0 to 10 and determines to which extend the stock is consolidating. This is achieved by evaluating multiple short term technical indicators. COST currently has a 8 as setup rating:
COST has an excellent technical rating and also presents a decent setup pattern. Prices have been consolidating lately and the volatility has been reduced. There is a support zone below the current price at 958.84, a Stop Loss order could be placed below this zone.
Trading breakout setups.
A breakout opportunity may arise when the stock surpasses the current consolidation zone and reaches new highs. Traders often wait for this breakout before considering buying the stock. To manage risk, a stop loss order could be placed below the consolidation zone to limit potential losses.
This article should in no way be interpreted as trading advice. You should always make your own analysis and trade or not trade based on your own observations and style. The article is based purely on some technical observations.
Every day, new breakout setups can be found on ChartMill in our Breakout screener.
Keep in mind
This is not investing advice! The article highlights some of the observations at the time of writing, but you should always make your own analysis and invest based on your own insights.


