
Wall Street Holds Steady Ahead of Major Earnings and Economic Data
Markets Recover After a Shaky Start
Wall Street kicked off a busy earnings week with cautious trading, as investors weighed new trade developments, awaited key economic data, and monitored fresh corporate results. Despite an uncertain start, major indexes managed to recover most early losses by the closing bell.
The Dow Jones Industrial Average finished up 0.3% at 40,227.59, while the S&P 500 edged 0.1% higher to 5,528.75. The Nasdaq Composite slipped slightly, ending the session down 0.1% at 17,366.13.
Trade Policy Uncertainty Looms
Investor sentiment was clouded by ongoing uncertainty surrounding US trade policy. Treasury Secretary Scott Bessent defended the administration's mixed signals on tariffs, describing the approach as "strategic uncertainty."
While he hinted at "very good" tariff proposals from several major trade partners, no concrete agreements have been reached yet.
Earnings Wave in Focus
Trade talks aside, all eyes are on a wave of upcoming earnings reports, particularly from tech giants Microsoft (MSFT | -0.18%), Apple (AAPL | +0.41%), Amazon (AMZN | -0.68%), and Meta (META | +0.45%).
UBS estimates that the 180 S&P 500 companies reporting this week account for over 40% of the index’s market cap, making this a pivotal moment for broader market direction.
Analyst Chris Larkin of Morgan Stanley noted that a continuation of last week's rally may hinge on signs of a dovish shift in trade policy with China.
Nvidia Under Pressure as Huawei Develops Rival AI Chip
In corporate news, chipmaker Nvidia (NVDA | -2.05%) fell over 2% after reports surfaced that China's Huawei is developing a new AI chip—the Ascend 910D—designed to rival Nvidia’s high-end H100 models.
This move comes as US export restrictions tighten, threatening Nvidia’s significant Chinese market share. Earlier this year, Nvidia disclosed a $5.5 billion write-down tied to new restrictions on selling its H20 chips to China.
Company Highlights:
Tesla (TSLA | +0.33%) shares added 0.3% following positive sentiment after CEO Elon Musk pledged to spend more time at Tesla’s headquarters.
Domino’s Pizza (DPZ | +0.63%) rose 0.6%, buoyed by better-than-expected earnings per share, despite revenue falling short of forecasts.
IBM (IBM | +1.61%) revealed plans to invest $150 billion in US technology over the next five years, pushing its stock up 1.6%.
Auto Industry Boosted by Tariff Relief
Automakers enjoyed a rally after news that the Trump administration plans to roll back some tariffs on foreign-made parts used in US-assembled vehicles.
South Korean carmakers Hyundai and Kia rallied nearly 2% in response. Japanese automakers could not immediately react as the Tokyo market was closed.
Key Economic Data Ahead
On the macroeconomic front, traders are preparing for several important data releases this week, including consumer confidence numbers, the JOLTS job openings report, and PCE inflation figures, a key indicator for the Federal Reserve’s monetary policy decisions.
Other Market Movers: Oil and Currency
Elsewhere, oil prices slid, with the June WTI crude future falling $0.97, or 1.5%, to settle at $62.05 per barrel.
Meanwhile, the euro strengthened against the dollar, trading around 1.1421 after starting the New York session near 1.1353.
Looking Ahead
As the week progresses, the market’s direction will likely be shaped by the earnings wave, economic data, and any new developments on the trade front.
With so many moving pieces, volatility could remain elevated.
Daily Market Analysis – April 28, 2025 (After Market Close)
Short Term Trend
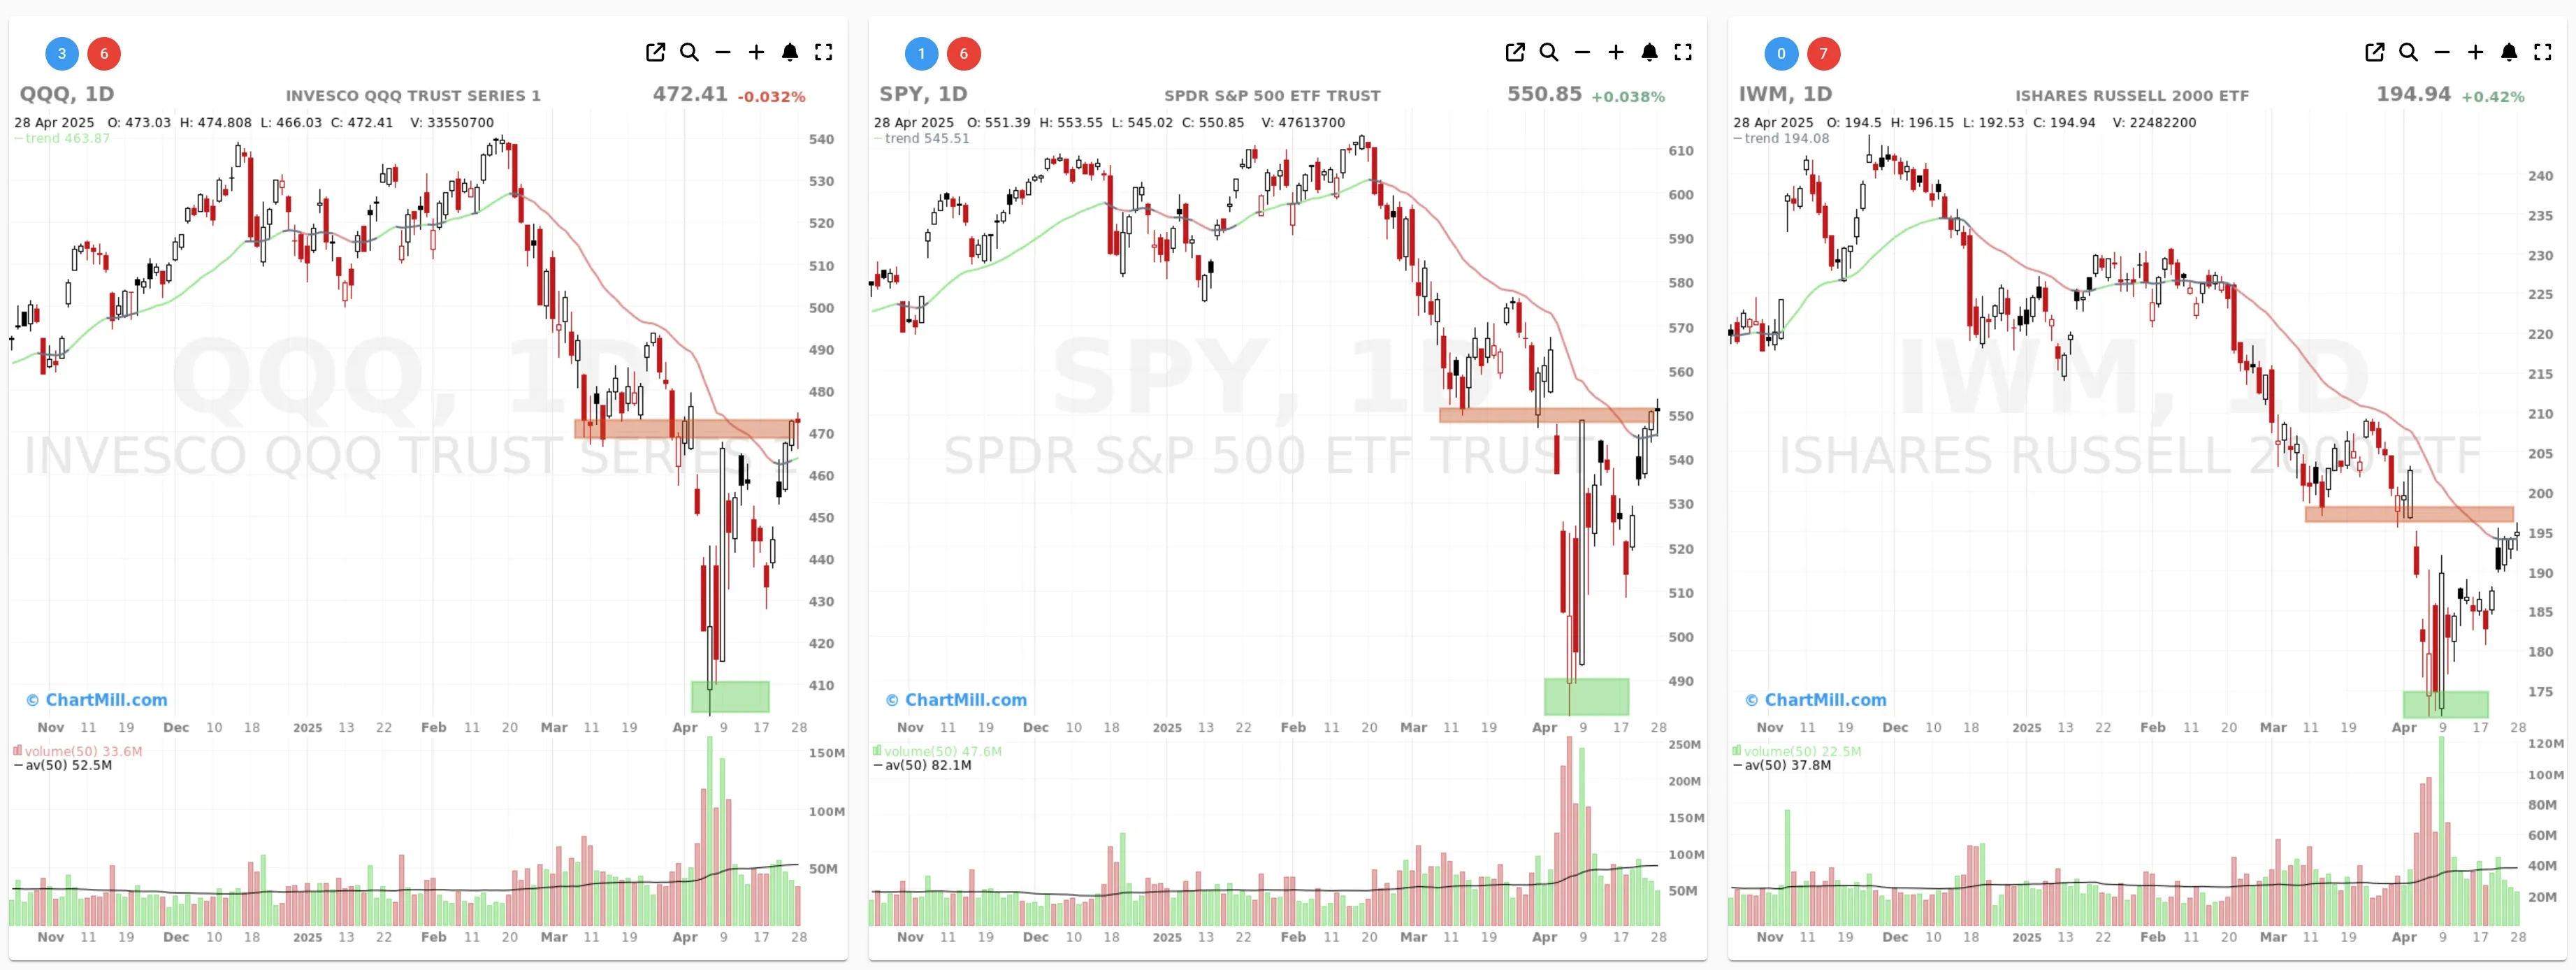
- Short-Term Trend: Bullish (from neutral)
- Support at $500
- Resistance at $550
- Volume: Below average (50)
- Pattern: Hanging Man candlestick (bearish warning signal)
- Short-Term Trend: Neutral (no change)
- Support at $415
- Resistance at $466
- Volume: Below average (50)
- Pattern: Hanging Man candlestick (bearish warning signal)
- Short-Term Trend: Neutral (no change)
- Support at $170
- Resistance at $197
- Volume: Below average (50)
- Pattern: Doji candlestick (neutral, uncertainty)
Long Term Trend

- Long-Term Trend: Down (no change)
- Long-Term Trend: Down (no change)
- Long-Term Trend: Down (no change)
Market Breadth Analysis for April 28, 2025 (After Market Close)

Recent Market Action: Strength Moderates
Over the past six sessions, market breadth remained generally positive, although momentum has slightly softened:
-
On April 28, 2025, 62.9% of stocks advanced, while 34.2% declined — a slight uptick compared to April 25 (55.3% advances).
-
The Advance-Decline spread is still favorable, indicating buying interest remains dominant but less aggressive than the sharp rallies seen earlier last week (e.g., April 22–24 when advances exceeded 80%).
Technical Condition: Improving Participation Above Moving Averages
The proportion of stocks trading above their key simple moving averages (SMAs) continues to improve:
-
81.5% of stocks are now above their 20-day SMA — a strong short-term signal.
-
34.4% are above their 50-day SMA, 27.1% above the 100-day SMA, and 26.5% above the 200-day SMA.
Compared to the beginning of the week (April 21), there’s a clear and steady climb, particularly above the 20-day SMA (up from 22.2% to 81.5%).
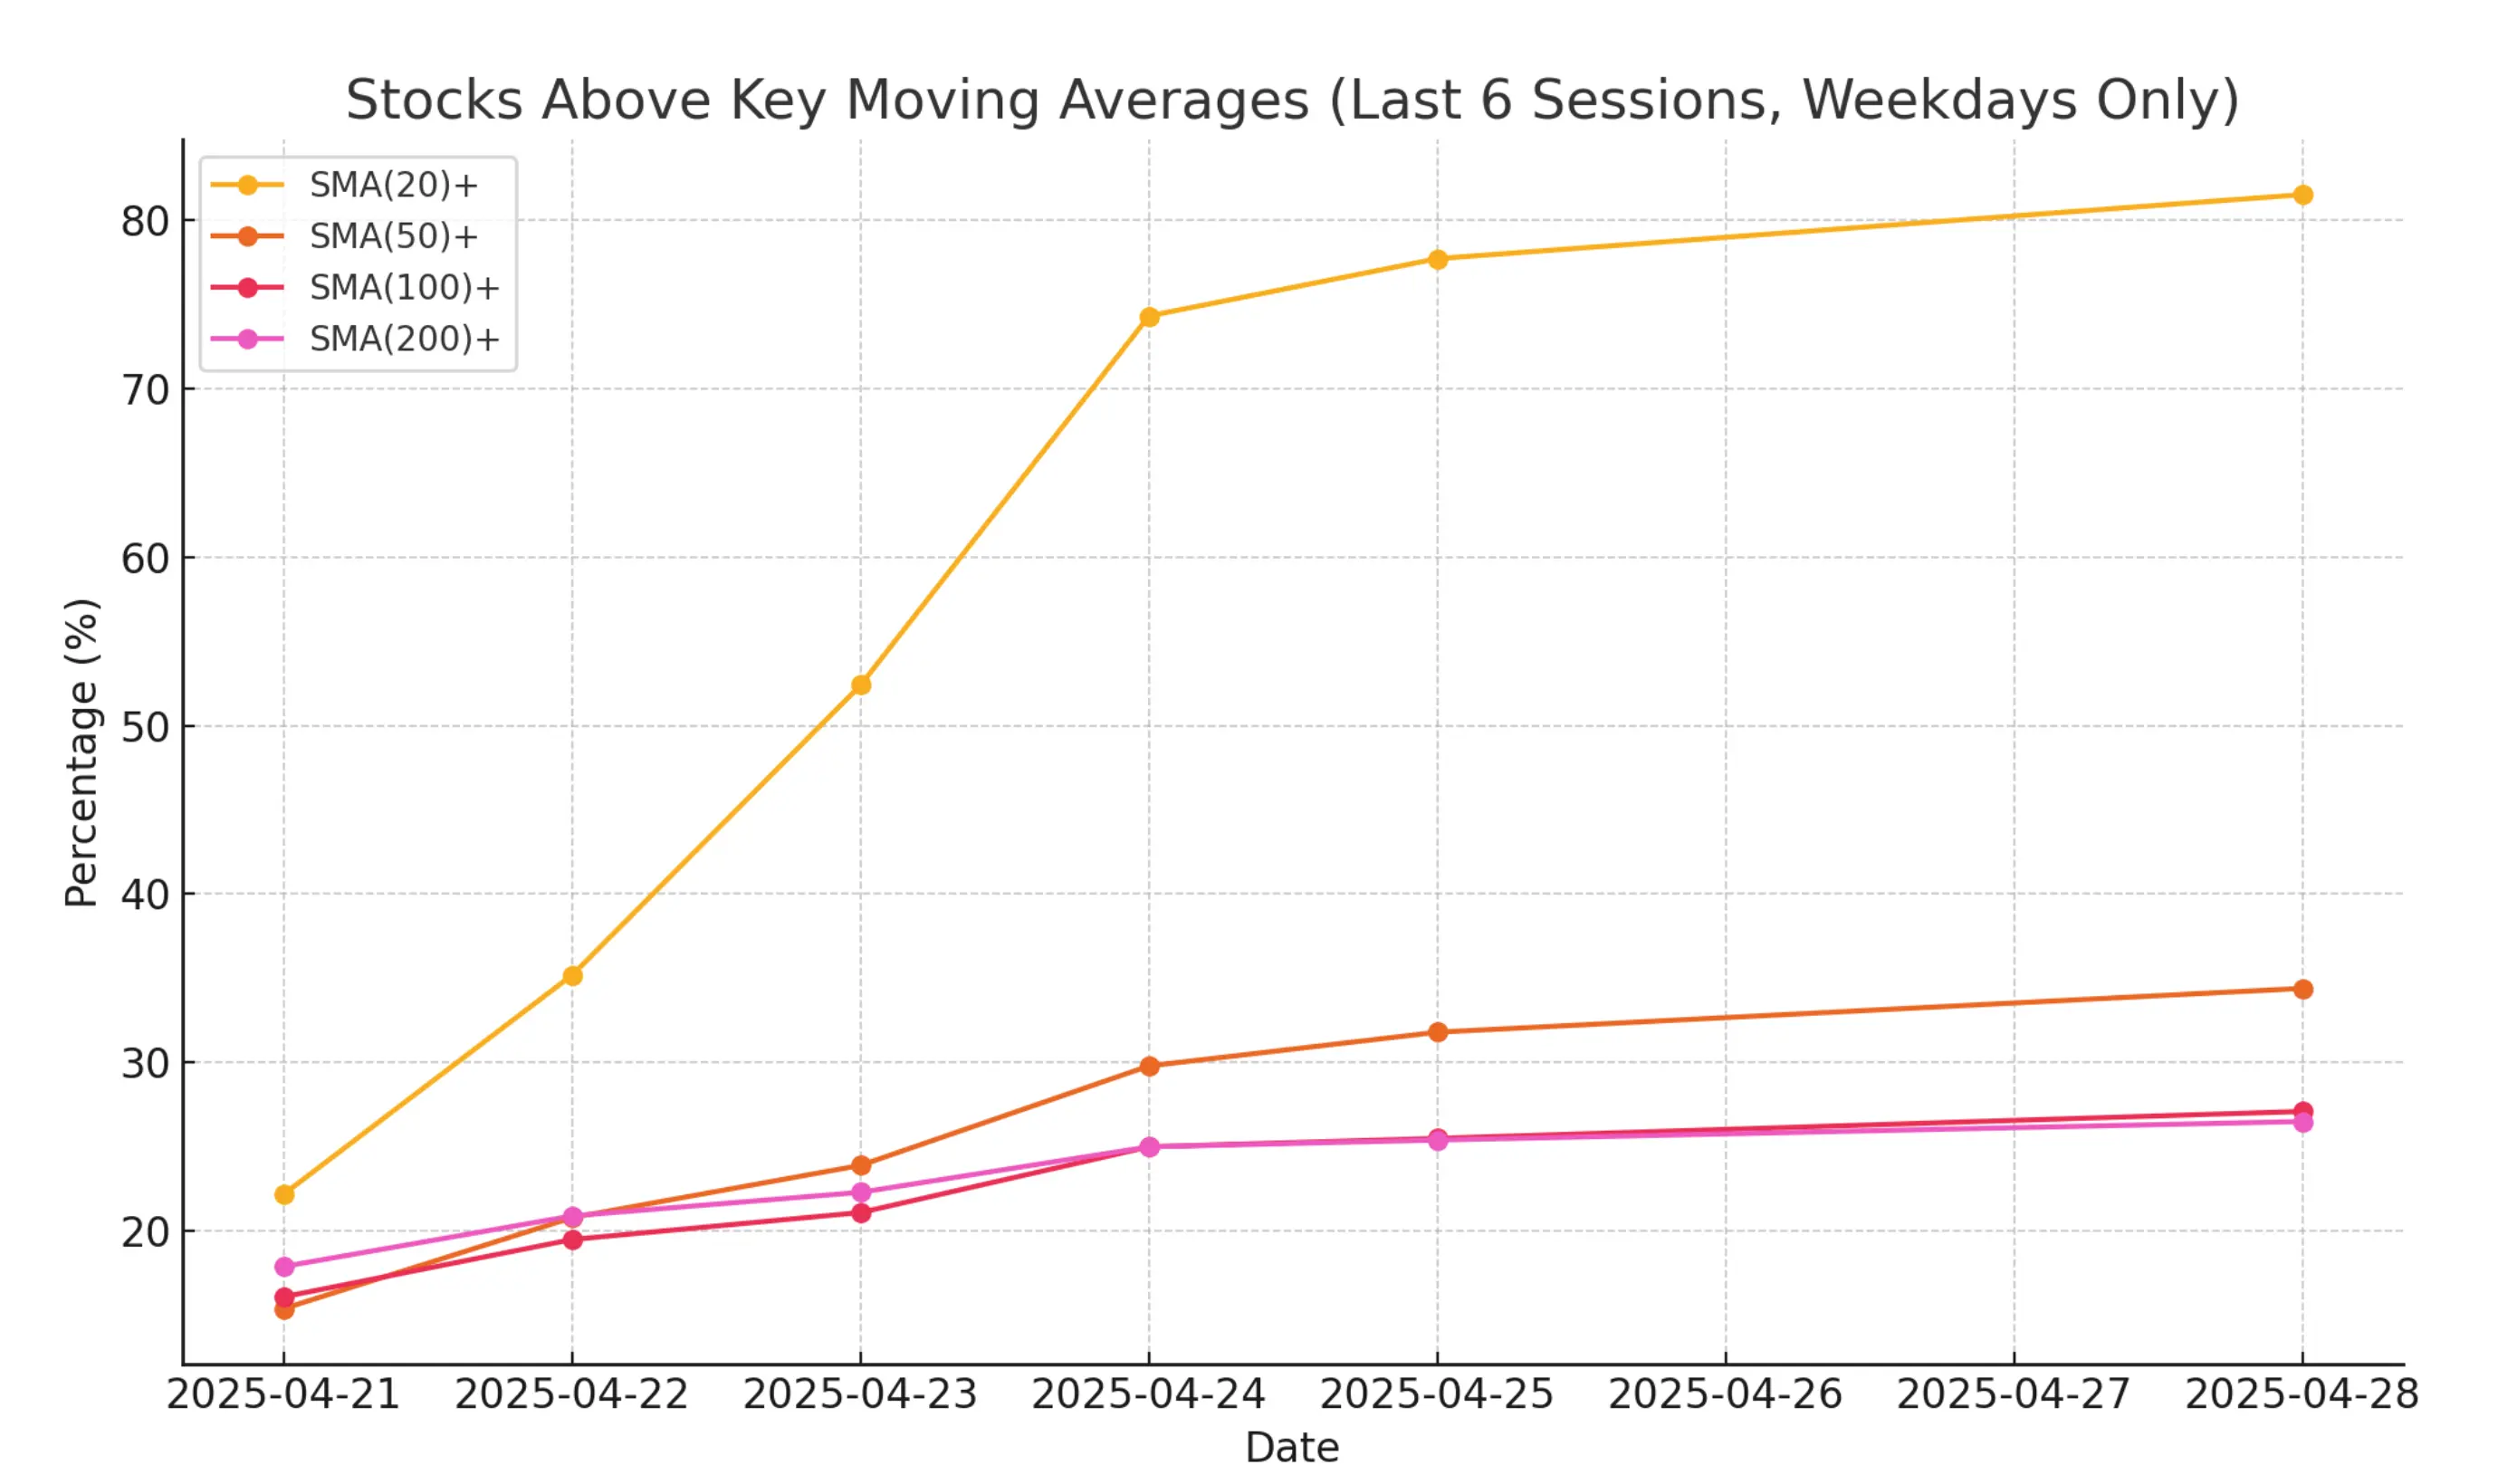
Takeaway:
-
Short-term momentum is robust, but longer-term strength (50- to 200-day SMAs) is still lagging behind. This suggests the rally is young or still in its recovery phase.
-
Weekly Breadth: Strong but Tapering Over the past week, 89.1% of stocks advanced and only 10.5% declined — very bullish breadth. However, the advance rates were slightly stronger earlier in the week (over 86%) and are now stabilizing just below 63% daily.
-
Potential caution: Peaks in breadth often precede minor pullbacks or consolidation phases.
Conclusion
Market breadth remains positive and supportive of further upside in the near term. Some minor signs of deceleration suggest that the pace of gains could slow, and a short-term consolidation is possible, especially as key earnings reports and macroeconomic data are released this week.
If breadth weakens further or fails to expand above medium- and long-term moving averages, a more cautious approach may be warranted.